Part 10. How to Monitor Your Systems
Update, June 25, 2024: This blog post series is now also available as a book called Fundamentals of DevOps and Software Delivery: A hands-on guide to deploying and managing software in production, published by O’Reilly Media!
This is Part 10 of the Fundamentals of DevOps and Software Delivery series. In Part 9, you learned how to store, query, replicate, and back up your data. That blog post focused primarily on data about your customers, such as user profiles, purchases, photos, and so on. This blog post will focus primarily on data that gives you visibility into your business, or what is typically referred to as monitoring.
In the Preface, you heard about LinkedIn’s software delivery struggles. Here’s one more: we had virtually no monitoring. We did collect metrics and logs, but the tools to understand that data were unusable, so we were often flying blind. Bugs and outages could go unnoticed for days, sometimes until users complained loudly enough that we took notice. In 2010, an intern created inGraphs, a UI for visualizing our metrics. It had a profound impact on the company, as suddenly, we could spot problems earlier and understand what users were doing. We overhauled monitoring even more as part of Project Inversion, and before long, inGraphs was on TVs all over the office. As David Henke, LinkedIn’s SVP of Engineering and Operations, liked to say: if you can’t measure it, you can’t fix it.
So, what should you measure? The following four items are the most commonly-used monitoring tools and techniques:
-
Logs
-
Metrics
-
Events
-
Alerts
This blog post will dive into each of these topics, and as you go through them, you’ll try out a number of examples, including using structured logging in Node.js, creating a dashboard of EC2 metrics in CloudWatch, and configuring Route 53 health checks with alerts to notify you if your service is down. Let’s get started by looking at logs.
Logs
// How real programmers debug

console.log("*************************** here")
Almost every piece of software writes logs, which are records of what’s happening in that software: e.g.,
interesting events, errors, debugging information, and so on. Interactive CLI tools typically write
log messages to the terminal (to the stdout and stderr streams); other types of software typically write
log messages to files. These log messages are useful for a variety of purposes:
- Debugging problems
-
When something goes wrong, the logs are usually the first thing you check to understand what’s going on. If you do a good job with logging, you’ll be able to find the events that led up to the error, and sometimes, you’ll have an error message and even a stack trace (the sequence of nested function calls that led to the error) that shows the exact line of code causing the problem.
- Analyzing your software
-
Analyzing log files can provide a number of insights about user behavior, performance bottlenecks, and other aspects of your systems.
- Auditing your software
-
Logs provide an audit trail of the events in your system, which can be useful for compliance and security (e.g., to investigate a security incident).
|
Key takeaway #1
Add logging throughout your code to give you visibility into what’s happening in your systems. |
Instead of console.log (or its equivalent in your programming language), you should use a dedicated logging library,
such as Log4j or Winston for JavaScript
(full list), to get the
following benefits:
-
Log levels
-
Log formatting
-
Structured logging
-
Log files and rotation
-
Log aggregation
The following sections will look at each of these items, starting with log levels.
Log Levels
Most logging libraries support multiple log levels, which allow you to specify the severity of each log message. Table 20 shows the typical log levels you’ll see in most libraries (sometimes with slightly different names), ordered from least to most severe:
| Level | Purpose | Example |
|---|---|---|
Trace |
Detailed, fine-grained visibility into the step-by-step execution path of the code. |
Log the entrypoint of every function to show the full code execution path. |
Debug |
Diagnostic information that may be useful in debugging and troubleshooting. |
Log the contents of a data structure to help understand a bug. |
Info |
Important information you want to capture for every user and request. |
Log each time a user completes a purchase successfully. |
Warn |
Unexpected problems that do not cause the software to fail. |
Log a warning when the database is missing some data, but you have a fallback you can use. |
Error |
Errors that cause some part of the software to fail. |
Log an error when the database is missing some data that causes a feature to break. |
Fatal |
Errors that cause the software to fail entirely and need to be addressed immediately. |
Log a fatal error when the database is completely down and you can’t serve any requests. |
Example 181 shows how to use the Winston library to do logging in JavaScript:
  const logger = winston.createLogger({            (1)

    level: 'info',                                 (2)

    format: winston.format.simple(),               (3)

    transports: [new winston.transports.Console()] (4)

  });


  logger.info('Hello, World!');                    (5)
Here’s what this code does:
| 1 | Create a new instance of the logging library. |
| 2 | Set the log level to info. |
| 3 | Use Winston’s "simple" formatter. You’ll learn more about log formatting later. |
| 4 | Output the logs to the terminal. |
| 5 | Use the logging library instance to log "Hello, World!" at info level. |
If you run this code, you’ll see:
info: Hello, World!This might not seem like a big improvement over console.log, but using log levels has several advantages. First, all
logging libraries allow you to specify the minimum log level, and they will automatically discard any messages that
have a lower severity. For example, consider the log statements in Example 182:
  logger.debug('A message at debug level');

  logger.info('A message at info level');

  logger.error('A message at error level');
When you run this code, you’ll see the following output:
info: A message at info level

error: A message at error level
Notice how the debug message is missing. Since the logger in Example 181 sets the log level to info, only messages at info and above are going to be recorded. Log levels allow you to add lots of trace and debug logging throughout your code without making the logs too noisy during production usage, while still having the ability to use a lower log level in dev, or even in prod (temporarily) while troubleshooting.
Log levels also make it easier to scan the logs, both visually, and with tools such as grep. For example, if you had
a log file that was thousands of lines long, you could use grep to filter the log to just the error messages, as shown
in Example 183:
grep to filter a log file for errors$ grep '^error:' log.txt
error: Example error message.
error: Another example of an error message.Log levels are only one of the benefits you get from using a logging library. Another big benefit is the ability to standardize the format of all your log messages, which can make it even easier to read and scan your logs, as discussed in the next section.
Log Formatting
Just about all logging libraries allow you to define the format to use for your log messages. Example 184 shows how to apply basic formatting to a Winston logger:
  const logger = winston.createLogger({

    level: 'info',

    defaultMeta: req,                                                          (1)

    format: winston.format.combine(

      winston.format.timestamp(),                                              (2)

      winston.format.printf(({timestamp, ip, method, path, level, message}) => (3)

        `${timestamp} ${ip} ${method} ${path} [${level}]: ${message}`

      ),

    ),

    transports: [new winston.transports.Console()]

  });


  logger.info('A message at info level');

  logger.warn('A message at warn level');

  logger.error('A message at error level');
The preceding code applies the following formatting to each log message:
| 1 | Make the request object (e.g., from Express.js) available to the log formatter. |
| 2 | Make the timestamp available to the log formatter. |
| 3 | Format each log message to show the timestamp, data from the request object (user IP, HTTP method, HTTP path), the log level, and then the message. |
When you run this code, you see the following:
2024-10-05T20:17:49.332Z 1.2.3.4 GET /foo [info]: A message at info level

2024-10-05T20:17:49.332Z 1.2.3.4 GET /foo [warn]: A message at warn level

2024-10-05T20:17:49.332Z 1.2.3.4 GET /foo [error]: A message at error level
Using log formatting ensures every message uses the same standardized pattern, which makes it easier to read and parse the logs. It also allows you to include useful contextual information (metadata) to help you understand what was happening when each message was logged. Now, each log message tells a little self-contained story: at this time, a certain user sent an HTTP request for a specific path, and here’s a message about it, at a specific severity. These stories become even more useful if you use multiple named loggers, and update the log format to show each logger’s name. Example 185 shows how you can create multiple Winston loggers:
  const createLogger = (name, level) => {                           (1)

    return winston.createLogger({

      level: level,

      defaultMeta: req,

      format: winston.format.combine(

        winston.format.timestamp(),

        winston.format.label({label: name}),                        (2)

        winston.format.printf(

          ({timestamp, label, ip, method, path, level, message}) => (3)

          `${timestamp} [${label}] ${ip} ${method} ${path} [${level}]: ${message}`

        ),

      ),

      transports: [new winston.transports.Console()]

    });

  };


  const loggerA = createLogger('A', 'info');                        (4)

  const loggerB = createLogger('B', 'warn');                        (5)


  loggerA.info('A message at info level');

  loggerB.info('A message at info level');

  loggerA.warn('A message at warn level');

  loggerB.warn('A message at warn level');
This code does the following:
| 1 | createLogger creates a logger with the given name and level. |
| 2 | In Winston, the convention for naming a logger is to set it as a label. |
| 3 | Update the log format to include the label (the logger name) in brackets. |
| 4 | Create a logger for module A, set to info level. |
| 5 | Create a logger for module B, set to warn level. |
The output from the code is as follows:
2024-10-05T20:19:43.040Z [A] 1.2.3.4 GET /foo [info]: A message at info level

2024-10-05T20:19:43.040Z [A] 1.2.3.4 GET /foo [warn]: A message at warn level

2024-10-05T20:19:43.040Z [B] 1.2.3.4 GET /foo [warn]: A message at warn level
Using multiple loggers allows you to see what part of your code is doing the logging. It also allows you to configure different logging settings (such as different log levels) for different parts of your code, so if you’re seeing strange behavior in one subsystem, you can turn up logging just for that part of the code, or if another subsystem is spamming the logs too much, you can turn down the log level for just that subsystem. You can also choose to include different metadata with the logs for each subsystem, making the self-contained stories more relevant to their particular domain.
One trend you may have noticed is that the logs become more useful as you add more and more metadata to them: e.g., IP address, module name, timestamp, and so on. This leads to structured logging, as described in the next section.
Structured Logging
For years, logging text strings and defining fancy formats was the gold standard, and every piece of software, every library, every language, and every developer formatted their logs a bit differently. This made it hard to build tooling that could automatically parse, search, and filter logs.
In recent years, there has been a push to move to structured logging, where you output logs in a well-defined data format such as JSON or XML, rather than as arbitrary strings. This makes it easier to build a variety of tooling that can parse and interpret the logs. Example 186 shows how to configure the Winston to output logs as JSON:
  const createLogger = (name, level) => {

    return winston.createLogger({

      level: level,

      defaultMeta: req,

      format: winston.format.combine(

        winston.format.timestamp(),

        winston.format.label({label: name}),

        winston.format.json() (1)

      ),

      transports: [new winston.transports.Console()]

    });

  };

  const loggerA = createLogger('A', 'info');


  loggerA.info('A message at info level');
There’s only one change from the previous example:
| 1 | Switch from the custom printf-based format to JSON formatting. |
Here’s the output from this code (note, the output has been reformatted to fit this blog post series; it would normally all be on one line):
{

  "ip":"1.2.3.4",

  "label":"A",

  "level":"info",

  "message":"A message at info level",

  "method":"GET",

  "path":"/foo",

  "timestamp":"2024-10-05T20:21:49.231Z"

}
The advantage of structured logging is that it is both human-readable—arguably, it’s more readable, as every field has
a clear label—and machine-readable, which makes it easier to parse, search, filter, and analyze. Also, over time,
structured logging changes how you use your log library, from logging strings (e.g., logger.info("text")) to logging
key-value pairs, as shown in Example 187:
  loggerA.info({

    request_id: req.id,

    user_id: user.id,

    action: "complete-purchase",

    product_id: product.id,

    product_price: product.price,

    message: `User bought ${product.name}`

  });
The preceding code produces the following output (again, reformatted to multiple lines to fit in this blog post series):
{

  "action":"complete-purchase",

  "id":"53ebcb5a-038d-4e6a-a171-7132000c68fd",

  "ip":"1.2.3.4",

  "label":"A",

  "level":"info",

  "message":"User bought Fundamentals of DevOps and Software Delivery",

  "method":"GET",

  "path":"/foo",

  "product_id":1098174593,

  "product_price":"$54.99",

  "request_id":"53ebcb5a-038d-4e6a-a171-7132000c68fd",

  "timestamp":"2024-10-05T20:21:49.231Z",

  "user_id":53345644345655

}
Instead of thinking of arbitrary strings with a little bit of relevant information, you start thinking of logging as a way to capture as much context as you can, in the form of key-value pairs, about what’s happening. As you’ll see later in this blog post, these ideas are closely related to the shift to structured events, observability, and tracing.
So far, all the examples in this blog post have logged directly to the terminal, but most software stores logs in files, as per the next section.
Log Files and Rotation
Seeing logs in an interactive terminal session while you’re coding is great, but when you’re not around (e.g., when your code is running in production, on a server), you need to capture the log output and store it in files. This way, your log history is persisted, so you can go back any time, and see what happened in the past. Example 188 shows an example of how to send the log output to a file:
  const createLogger = (name, level) => {

    return winston.createLogger({

      level: level,

      defaultMeta: req,

      format: winston.format.combine(

        winston.format.timestamp(),

        winston.format.label({label: name}),

        winston.format.json()

      ),

      transports: [

        new winston.transports.Console(),

        new winston.transports.File({ (1)

          filename: `module${name}.log`

        })

      ]

    });

  };


  const loggerA = createLogger('A', 'info');

  const loggerB = createLogger('B', 'info');
There is only one change:
| 1 | Log to a file named "module-", followed by the given logger name. |
When you run this code, and start logging messages with loggerA and loggerB, you end up with two files on disk,
moduleA.log and moduleB.log. moduleA.log will have just the logs from loggerA and moduleB.log will have just
the logs from loggerB. Now you can check the file for the module you’re interested in and use the timestamps to go
back to whatever point in time you need.
Note that, over time, log files can become huge. To ensure the files don’t become so large that it’s too hard to
browse them, and to prevent running out of disk space, you should typically configure log rotation, where you set up
an automated process to rename, compress, and possibly delete log files once they hit a certain file size or age. On
most Linux systems, you can use logrotate to do this for you. Alternatively,
some logging libraries have log rotation features built-in, as shown in Example 189:
  const createLogger = (name, level) => {

    return winston.createLogger({

      level: level,

      defaultMeta: req,

      format: winston.format.combine(

        winston.format.timestamp(),

        winston.format.label({label: name}),

        winston.format.json()

      ),

      transports: [

        new winston.transports.Console(),

        new winston.transports.File({

          filename: `module${name}.log`,

          maxsize: 10000000,  (1)

          maxFiles: 10,       (2)

          zippedArchive: true (3)

        })

      ]

    });

  };
This code uses the Winston library to do the following:
| 1 | Rotate log files that exceed 10 MB. The older log data will be moved to a file with a counter added as a suffix: e.g., moduleA1.log, moduleA2.log, etc. |
| 2 | Once you exceed 10 log files, delete the oldest one. |
| 3 | Compress the older log files, so they take up less disk space. That means the older log files will actually be called moduleA1.log.gz, moduleA2.log.gz, and so on. |
In addition to configuring log rotation to ensure your servers don’t run out of disk space, you should also configure log aggregation, as discussed in the next section.
Log Aggregation
If your software is on a single server, looking at its log files is no problem. But when you run your software across dozens of different servers, any one of which may contain the log messages you need, finding the right log file can be a significant challenge. The solution is to use log aggregation tools that send logs from all of your servers to a single, central destination that can store the log data and provide an interface to analyze (search and filter) that data.
Some of the major players in the log storage and analysis space include Elasticsearch (with Logstash), Loggly, Sumo Logic, and Splunk (full list. Most of these tools provide their own custom data collector tools that you can run on your servers to ship logs to the central data store. There are also several data-store agnostic data collector tools (full list) that can ship logs to many different destinations, including Syslog, Fluentd, and OpenTelemetry Collector (you’ll learn more about OpenTelemetry later in this blog post).
For example, the Lambda functions you deployed in previous blog posts automatically aggregate their
logs in CloudWatch Logs. Logs in CloudWatch are organized into log groups, which for a Lambda function named
function-name will end up being a log group named /aws/lambda/<function-name>. If you head to the
CloudWatch Logs Console, search for the name
of a Lambda function, such as "lambda-rds-app" from Part 9, and click on its log group
(/aws/lambda/lambda-rds-app), you’ll see all the log streams that represent the different instances of that Lambda
function, as shown in Figure 93:
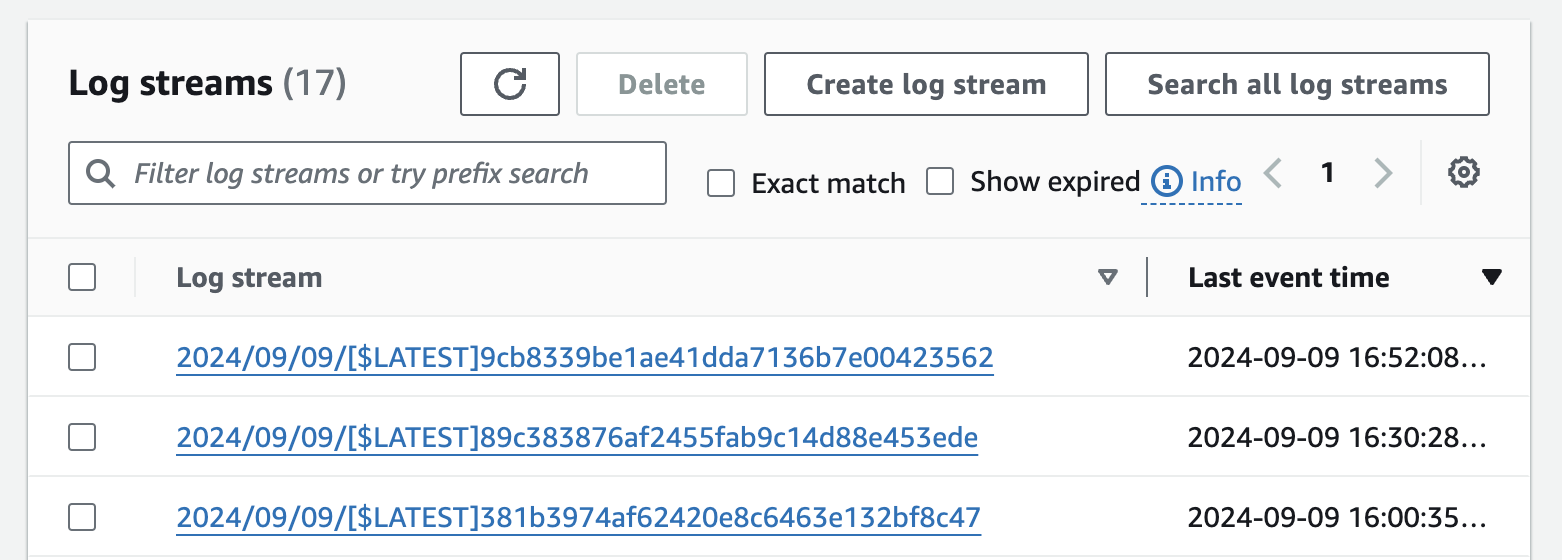
lambda-rds-app Lambda functionEven though this Lambda function has had many instances that ran across many servers, all the logs are aggregated into
CloudWatch Logs, so you can see and search them in a single place. Click the "Search all log streams" button in the
top-right corner and try searching for a term such as "knex" (since the lambda-rds-app used Knex.js to access the
database), as shown in Figure 94:
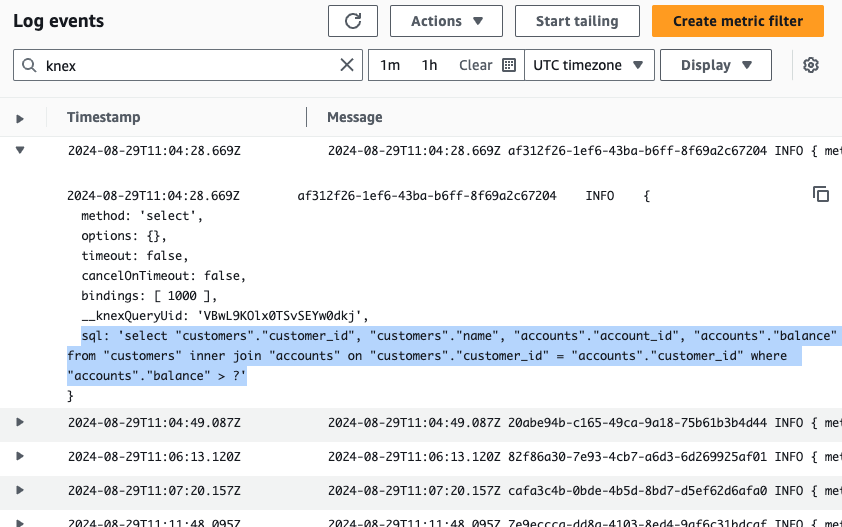
If you see some results with database queries, congrats, you’re seeing log aggregation in action! Note that Lambda also automatically includes metadata in each log message, such as timestamp and request ID.
|
Get your hands dirty
Here are a few exercises you can try at home to go deeper:
|
Log aggregation has several major advantages:
- A single pane of glass
-
You can search all your logs, across all your servers, in a single place.
- Powerful analysis tools
-
If you’re looking at log files directly on a server, you’re typically limited to using tools such as
grepfor search. Most log aggregation tools have more powerful analysis tools: e.g., search, filters, historical comparisons, etc. - Efficient storage
-
Log aggregation tools can typically store log data more efficiently than app servers, which allows you to keep the log data around for a longer time.
|
Key takeaway #2
Use log levels, log formatting, multiple loggers, structured logging, log file rotation, and log aggregation to make your logging more effective. |
Logs are ubiquitous in the world of software, and they are often the first place you turn to discover and investigate problems. However, to discover and investigate some problems, you need measurements, analysis, and visualization. This is where metrics come into the picture, as discussed in the next section.
Metrics
Metrics are quantitative measurements of important aspects of your software. Collecting, analyzing, and visualizing metrics gives you valuable insights into your software, including the following:
- Detect problems
-
Metrics are often how you discover problems in your systems. For example, a sudden spike in latency metrics is typically an early warning sign of a problem.
- Understand user behavior
-
Metrics can help you understand how your users are using your products, what’s working, and what’s not. For example, most websites track page view and monthly active user (MAU) metrics to get an understanding of user engagement.
- Improve system performance
-
Metrics can help you identify bottlenecks in your software and to improve latency, throughput, resource usage, and so on. For example, tracking garbage collector (GC) metrics for your Java apps can help you tune your GC settings to minimize stop-the-world pauses.
- Improve team performance
-
Metrics can also give you insight into bottlenecks in how you build your software, allowing you to improve the performance of your team. For example, many companies try to track and improve DORA metrics (which you saw in The Impact Of World-Class Software Delivery).
Metrics are a key source of continuous feedback that allows for continuous improvement, two central tenets of the DevOps and Agile movements.
|
Key takeaway #3
Use metrics to detect problems, understand user behavior, improve product and team performance, and more generally, as a mechanism for continuous feedback and improvement. |
Here are the topics the following sections will cover:
-
Types of metrics
-
Using metrics
-
Example: metrics in CloudWatch
Let’s start by looking at the different types of metrics.
Types of Metrics
Broadly speaking, you can categorize metrics into the following buckets:
-
Availability metrics
-
Business metrics
-
Application metrics
-
Server metrics
-
Team metrics
The following sections will dig into each of these, starting with availability metrics.
Availability metrics
Availability, or whether users can access and use your product, is the most basic metric that every company should measure. This is largely a "yes" or "no" question: either your service is available to your users or it’s not. Therefore, to track availability, you need to test the interface used by your customers: e.g., if your product is a website, you need a monitoring tool that regularly sends HTTP requests to various endpoints, and checks it gets an expected response. You can set up your own tooling to monitor availability, though the same problems that take down your product (e.g., a data center outage) could also break your availability tooling. A better option may be to use third-party services that can test your service from multiple locations around the world. Some of the major players in this space include Pingdom, Uptime Robot, and Amazon Route 53 Health Checks (full list).
These products can gather availability metrics over a long time, giving you a measure of your service’s reliability, which is often expressed as an order of magnitude based on the number of nines: e.g., 99.9% reliability is "three nines" and 99.999% reliability is "five nines." Many organizations set goals for how many nines they will provide, and some companies will include service level agreements (SLAs) in contracts with customers where they commit to one or more reliability goals, known as service level objectives (SLOs). For example, one of the SLOs might be five nines of reliability, with monetary penalties if you fail to achieve that SLO.
Note that 100% availability is not a realistic, practical, or useful target for any real-world SLO. There are three primary reasons for this. The first reason is that each additional nine of reliability is exponentially harder and more expensive to achieve, as shown in Table 21:
| Downtime per… | 90% | 99% | 99.9% | 99.99% | 99.999% | 99.9999% | 99.99999% |
|---|---|---|---|---|---|---|---|
Day |
2.4 hours |
14 minutes |
1.4 minutes |
8 seconds |
0.8 seconds |
0.08 seconds |
0.008 seconds |
Week |
16 hours |
1.6 hours |
10 minutes |
1 minute |
6 seconds |
0.6 seconds |
0.06 seconds |
Month |
73 hours |
7 hours |
44 minutes |
4 minutes |
26 seconds |
2.6 seconds |
0.26 seconds |
Year |
36 days |
3.6 days |
8.7 hours |
52 minutes |
5 minutes |
31 seconds |
3 seconds |
By the time you’re at seven nines of reliability (99.99999%), you’re only allowed 3 seconds of downtime per year. Any additional nines beyond that means you’re down for just microseconds per year, which is exceptionally difficult to achieve. For reference, the AWS EC2 SLA and Google Cloud Compute SLA targets four nines (99.99%), while the Azure SLA targets three nines (99.9%), and these three cloud providers likely invest more in the reliability of their services than you ever could, so targeting more than four or five nines is not realistic for most use cases.
The second reason 100% availability isn’t a reasonable goal is that, beyond a certain number of nines, your customers can’t tell the difference. For example, if your customer is on a mobile network that provides two nines (99%) of reliability, they won’t be able to tell the difference between a service that provides three nines (99.9%) or four nines (99.99%) of reliability, so the extra cost is unwarranted.
The third reason 100% availability isn’t a reasonable goal is that, to achieve extraordinarily high reliability, you have to stop all new development. This is because code changes and deployments are the most common source of outages (refer back to Table 11), so if you want a service to be perfectly stable, you will essentially have to stop making changes to it. Your customers and developers may want high reliability, but probably not at the cost of you never shipping new features again.
In practice, your reliability goal will need to be a balance between what your customers can tolerate in terms of downtime, what your customers want in terms of new feature development, and what your business can provide at a reasonable cost.
Business metrics
Business metrics are a measure of what your users are doing with your product, such as page views, ad impressions, sales, installs, and so on. There are many tools to track business metrics, including Google Analytics, KissMetrics, MixPanel, and PostHog (full list).
The typical audience for business metrics includes the CEO, the product team, and the marketing team, who use these metrics to inform their business decisions. The most basic version of this is to launch new features and products, and see how they impact your business metrics. The more sophisticated approach is to do A/B testing (AKA bucket testing), where you randomly split users into buckets, where each bucket sees a different version of the product, and you track which version improves your business metrics the most (this is often done using feature toggles, which you first saw in Part 5). For example, you could randomly split your users into two buckets, a bucket A with a new feature enabled, and a bucket B with a new feature disabled, and compare how the users perform at key metrics across the two buckets. Did the new feature increase engagement? Downloads? Purchases? Referrals?
This is just like a scientific experiment, with control and experimental groups. As long as (a) you randomly assign users to buckets, (b) the only difference between the buckets is the new feature, and (c) you gather enough data for it to be statistically significant, then you can be reasonably confident that any difference in metrics between the buckets is due to the new feature. In other words, you are using data to establish a causal relationship! This is sometimes called data-driven product development, and if you have the type of product where you can do it (i.e., you can show users different versions of the product, and you have sufficient traffic to generate statistically significant results), it can be transformational.[42]
Application metrics
Underneath the business metrics are the application metrics, which measure what your software is doing under the hood to power your business, including server-side metrics such as what URLs users are hitting, what response codes they are getting, how long your servers are taking to respond, and how much traffic your servers are handling, and client-side metrics such as page load times, JavaScript errors, user location, browser type, and screen resolution. You can also compute metrics from your application logs: e.g., track how many times a certain error message shows up in the logs, as that may be an early signal of a problem.
To gather server-side metrics, you typically use application performance monitoring (APM) tools such as Datadog, New Relic, and AppDynamics (full list). To gather client-side metrics, you typically use real user monitoring (RUM) tools, such as DataDog RUM, New Relic Browser Monitoring, and AppDynamics Browser RUM (full list).
A good starting point with application metrics is to focus on four metrics that are sometimes referred to as the four golden signals (or by the acronym LETS):
- Latency
-
Latency is a measure of how long it takes your application to service a request. An increase in latency is often an early indicator of problems, such as your servers being overloaded. High latency also has an adverse effect on your users. Your service may be "up" (the availability metrics look OK), but if pages take too long to load, customers may abandon your product.
- Errors
-
Errors are a measure of what percent of requests fail, including failures that are visible to users (e.g., a 500 response) or hidden from users (e.g., a connection to a database fails at first, but then succeeds on a retry).
- Traffic
-
Traffic is a measure of how much demand is on your software, typically measured in requests per second (rps) (AKA queries per second [QPS]). A sudden increase in traffic can overload your systems and lead to problems; a sudden drop in traffic can be an early indicator that something is wrong, such as users not being able to access your service due to a DNS misconfiguration.
- Saturation
-
Saturation is a measure of how much demand is on your hardware, typically measured as a percent utilization of some resource: e.g., CPU, memory, or disk utilization percentage. Beyond a certain saturation threshold, system performance usually degrades, leading to increased latency or possibly outages. For example, if your CPU usage is pegged above 90%, this may be a sign that the CPU is thrashing, using up most of its cycles context switching between threads, rather than doing productive work, which can drastically increase latency; if your disk space usage is above 90%, that may be a sign you need to free up space immediately, or you may have an outage when disk space runs out.
Server metrics
Below your application code, you get down to server metrics, which measure the underlying hardware, including metrics such as CPU usage, memory usage, hard drive usage, and network traffic. This is the space of infrastructure monitoring tools. Many of the APM tools from the previous section (e.g, Datadog, New Relic) can also measure server metrics; if you deploy to the cloud, the monitoring tools from the cloud providers (e.g., CloudWatch, Google Cloud Monitoring) may provide you with many of the server metrics you need. There are also tools that specialize in infrastructure monitoring, especially for on-prem deployments, including Nagios, Zabbix, and Sensu (full list).
Team metrics
Team metrics are metrics related to your software development process, such as build times, open pull requests, unresolved bugs, and code coverage. There are many sources of team metrics, including your version control system (Part 4), CI servers (Part 5), automated testing and code coverage tools (Part 4), issue tracking systems (e.g., Jira, Linear; full list), code quality tools (e.g., Codacy, SonarQube; full list), and developer productivity tools (e.g., Pluralsight, Faros AI; full list).
If you only have the resources to track a handful of team metrics, the DORA metrics you saw in Table 1 are a good starting point: deployment frequency, lead times, change failure rate, and recovery time. If you can improve these metrics within your team, you can considerably accelerate your software development process.
Now that you’ve seen all the different types of metrics, let’s talk about how you can actually use them.
Using Metrics
To make use of all the different kinds of metrics you just saw, there are three steps:
-
Collect metrics (instrumentation)
-
Store metrics
-
Visualize and analyze metrics
Some monitoring tools are designed to do all three of these steps, while others are focused on just one or two. The following sections will take a brief look at each of these steps, starting with how to collect metrics.
Collect metrics (instrumentation)
The first step is to instrument your software to capture and expose important metrics. Depending on the type of metrics you are trying to capture, there are several different ways to do this:
- Availability metrics
-
With most availability tools (e.g., Pingdom, Route 53 Health Checks), you configure what endpoints you want them to check, and they take care of collecting the availability metrics for you, without any additional instrumentation.
- Business metrics
-
To collect business metrics, you have to instrument your code, especially on the client-side. For example, to use Google Analytics, you add a JavaScript library from Google to every page on your website, and that library will automatically gather data about every page view, click, scroll event, and so on. You can also record custom metrics when important actions happen: e.g., when a user completes a purchase, you call a function in the Google Analytics library to record a custom metric with the ID of the product.
- Application metrics
-
To collect application metrics, you have to instrument your code on both the server-side and client-side. For server-side metrics, you can usually get some degree of automatic instrumentation by installing an agent on each server, or as a sidecar for each container. To get more detailed instrumentation, and to be able to customize the metrics you send, you can also install a language-specific library. For example, if you’re using Datadog as an APM, you can install the Datadog Agent to get automatic instrumentation. If your application is in Java, you can use the dd-java-agent.jar library to record custom metrics. For client-side metrics, you usually run a RUM library on the client: e.g., you might run the DataDog RUM JavaScript library in the web browser or the DataDog Mobile RUM library in your mobile apps.
- Server metrics
-
To collect server metrics, you typically need to install an agent on each server. One option is an agent designed for specific monitoring software, such as the Nagios Agent or Zabbix Agent. Another option is to use a platform-agnostic agent that can work with multiple monitoring tools, such as collectd or StatsD (full list). Finally, if you’re using the cloud, the cloud providers typically have their own agents built into the hypervisor, so you can get some degree of server metrics out-of-the-box, without having to install anything.
- Team metrics
-
To collect team metrics, you typically rely on the tools you are using: e.g., Jira’s built-in metrics, Codacy’s built-in metrics, etc.
Having to run so many different tools and agents to collect metrics is inefficient and makes it harder to migrate between vendors. This led to the creation of OpenTelemetry (OTel), an open source, vendor-neutral toolkit for collecting telemetry data: that is, metrics, logs, and traces (you’ll learn more about traces later in this blog post). OTel supports most major programming languages, many orchestration tools (e.g., Kubernetes, Lambda), and many metrics backends (a topic you’ll learn about in the next section), and it is emerging as the de facto standard for instrumenting your code, so I usually recommend using it over proprietary tools, especially for collecting application and server metrics.
After instrumenting your code to expose metrics, you need to store those metrics somewhere, as per the next section.
Store metrics
All the metrics you gather must be stored in a specialized data store, a metrics backend, that can handle the following:
- Storing a large volume of data
-
Every one of your services, servers, and containers will constantly be emitting metrics, so the data store needs to be able to handle a large volume of writes.
- Storing time-series data
-
Metrics data is a type of time-series data, where you are recording a number of data points, each with a timestamp, and you typically will need to store it in such a way that you can later slice and dice that data by timestamp.
- Storing data to support analysis
-
The point of storing metrics data is so that you can extract insights from that data, so the data store needs to support the ability to analyze the data in a number of different ways (you’ll see more about this in the next section).
Typically, you use a specialized columnar database (as you saw in Part 9) to store metrics data. Most of the monitoring tools you saw earlier, such as Google Analytics and Datadog, use their own proprietary data stores under the hood. That said, several metrics backends can be used with many other tools, such as Open Time Series Database (OpenTSDB) and Prometheus (full list).
Once the metrics are stored somewhere, the final step is to make use of them through visualization and analysis, as discussed in the next section.
Visualize and analyze metrics
The three most common things you do with metrics data are the following:
- Visualize and analyze the data
-
First, you slice and dice the data to find the information you want: e.g., the latency for a service over the last hour. To make sense of the data, you typically need to visualize it in the form of graphs, line charts, histograms, heat maps, etc. Many of the monitoring tools you read about earlier (e.g., Google Analytics, Datadog) have built-in user interfaces to do this sort of analysis and visualization. There are also a handful of metrics frontends that can work with multiple metrics backends, such as Grafana and Kibana (full list).
- Create dashboards and reports
-
Once you have sliced and diced the data to find visualizations you like, you can collect the most important ones into a dashboard. This gives you a single page where, at a glance, you can get a sense of the health of your systems. Many teams have dashboards up on big screens around the office, and you check them regularly to make sure things are working. You can also create reports from the data, which are documents you might share with your executive team, product team, or investors to help inform business decisions.
- Configure alerts
-
No one can stare at a dashboard all day long, so you usually configure alerts that notify you of problems. You’ll learn more this later in this blog post.
|
Key takeaway #4
Collect multiple types of metrics (availability, business, application, server, team) and build dashboards to focus on the most important metrics to your business. |
Let’s now try an example of metrics in the real world by using CloudWatch.
Example: Metrics in CloudWatch
In this section, you’ll see an example of how to use CloudWatch, which is a monitoring tool built into AWS, to get metrics for EC2 instances, ASGs, and ALBs. Out-of-the-box, CloudWatch provides application and server metrics for most AWS resources; you’ll also deploy Route 53 health checks to get availability metrics. Finally, you’ll gather all these metrics in a custom CloudWatch dashboard.
|
Example Code
As a reminder, you can find all the code examples in the blog post series’s sample code repo in GitHub. |
To get started, head into the folder you’ve been using for all the examples in this blog post series, and create a new ch10/tofu/live folder:
$ cd fundamentals-of-devops

$ mkdir -p ch10/tofu/live
Next, copy your asg-sample module from Part 3 into the tofu/live folder:
$ cp -r ch3/tofu/live/asg-sample ch10/tofu/live

$ cd ch10/tofu/live/asg-sample
The asg-sample module deploys an ASG with an ALB in front of it. It’s configured to deploy an AMI built from the
Packer template in ch3/packer (this is the sample app before you added TLS code to it in
Part 8). If you still have that AMI, you can reuse it; if not, see the Packer section of
Part 3 for how to build it again.
Next, add a Route 53 health check in main.tf, as shown in Example 190:
resource "aws_route53_health_check" "example" {

  fqdn              = module.alb.alb_dns_name (1)

  type              = "HTTP"                  (2)

  request_interval  = "10"

  resource_path     = "/"

  port              = 80

  failure_threshold = 1                       (3)


  tags = {

    Name = "sample-app-health-check"          (4)

  }

}
This code configures a Route 53 health check that will test your service from multiple endpoints around the world, with the following configuration:
| 1 | Send health check requests to the ALB domain name. |
| 2 | Send HTTP requests every 10 seconds to path "/" and port 80. |
| 3 | If the ALB fails even one check, it will be considered as down. |
| 4 | Give the health check the name "sample-app-health-check." |
Next, you can create a CloudWatch dashboard using a module called cloudwatch-dashboard, which is in the
blog post series’s sample code repo in the ch10/tofu/modules/cloudwatch-dashboard folder.
This module creates a dashboard that highlights a few specific metrics for the ASG, ALB, and Route 53 health checks.
Example 191 shows how to update main.tf to use the cloudwatch-dashboard module:
module "cloudwatch_dashboard" {

  source  = "brikis98/devops/book//modules/cloudwatch-dashboard"

  version = "1.0.0"


  name            = "sample-app-dashboard"               (1)

  asg_name        = module.asg.asg_name                  (2)

  alb_name        = module.alb.alb_name                  (3)

  alb_arn_suffix  = module.alb.alb_arn_suffix

  health_check_id = aws_route53_health_check.example.id  (4)

}
The preceding code configures the dashboard as follows:
| 1 | Name the dashboard "sample-app-dashboard." |
| 2 | The ASG name is used to highlight metrics for the EC2 instances in that ASG. |
| 3 | The ALB name and ARN suffix are used to highlight metrics for that ALB. |
| 4 | The Route 53 health check ID is used to highlight metrics for that check. |
Finally, add the dashboard URL as an output variable in outputs.tf, as shown in Example 192:
output "dashboard_url" {

  description = "The URL of the dashboard"

  value       = module.cloudwatch_dashboard.dashboard_url

}
Deploy as usual, authenticating to AWS, and running init and apply:
$ tofu init

$ tofu apply
It will take 3-10 minutes for the ASG to deploy and for the apps to boot up, so be patient. When everything is done, you should see two output variables:
alb_dns_name = "<ALB_DOMAIN_NAME>"

dashboard_url = "<DASHBORD_URL>"
Test the URL in the alb_dns_name output to check the app is working (make sure to use HTTP, as this app from back
in Part 3 does not support HTTPS):
$ curl http://<ALB_DOMAIN_NAME>

Hello, World!
You should see the usual "Hello, World!" text. Next open up the URL in the dashboard_url output, and you should see
a dashboard similar to Figure 95:
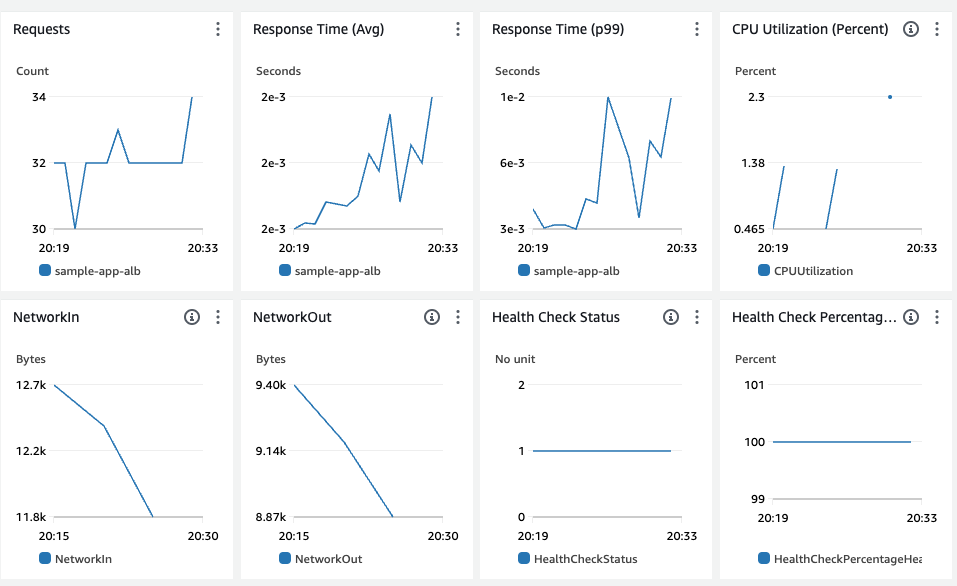
If the dashboard is empty, wait a few minutes for the Route 53 health checks to make requests to your app, and you should start seeing the following metrics:
-
The number of requests to your ALB.
-
The average response time from your ALB.
-
The p99 (99th percentile) response time from your ALB: that is, 99% of requests are handled in this amount of time or less.
-
The average CPU utilization across the ASG.
-
The amount of network traffic that came into the ASG.
-
The amount of network traffic that came out of the ASG.
-
The Route 53 health checks: 1 means it’s passing, 0 means it’s failing.
-
The percentage of Route 53 health checks that are passing.
Congrats, you’re now seeing a small set of useful application, server, and availability metrics! If you want to see all available metrics in CloudWatch, head over to the CloudWatch metrics dashboard; if you want to see more info on the availability metrics, head over to the Route 53 health checks dashboard.
|
Get your hands dirty
Here are a few exercises you can try at home to go deeper:
|
When you’re done testing, you may wish to run tofu destroy to clean up your infrastructure, so you don’t accumulate
any charges. Alternatively, you may want to wait until later in this blog post, when you update this
example code to enable alerts in CloudWatch. Either way, make sure to commit your latest code to Git.
Let’s now move on to the next section, where we’ll discuss structured events, and how they compare to other types of monitoring you’ve seen so far.
Events
In Part 9, you learned about event-driven architectures, where each of your services can publish events into an event stream, and these events can be consumed and processed by one or more other services. One especially useful way to consume events is for the purposes of monitoring, including the following:
-
Observability
-
Tracing
-
Testing in production (TIP)
The following sections will dive into each of these, starting with observability.
Observability
As your architecture becomes more complicated, and it evolves along the lines you saw in Section 1.4—e.g., you move from a monolith to microservices, from single-node systems to distributed systems, and so on—two things will start to happen:
-
You’ll hit more and more problems that you never predicted or anticipated.
-
The ratio of unpredictable problems to predictable problems will get worse.
By the time you get to the scale of massive companies like Google and Facebook, you’ll constantly be dealing with problems for which you don’t have, and never would’ve thought to have, automated tests, metrics, or dashboards. While you can anticipate that it’s worth monitoring the four golden signals (latency, traffic, errors, and saturation) in almost any company, what do you do for dealing with complex, unanticipated, and even unimaginable problems? How do you deal with the unknown unknowns? This is where observability comes into the picture.
Observability is a property of a system: in control theory, it’s a measure of how well the internal states of that system can be inferred from knowledge of its external outputs; in DevOps, it’s a measure of how well you can understand any state your software may have gotten itself into solely by interrogating that software with external tools. That means you can figure out what caused a problem, no matter how weird or unpredictable, without shipping new code, but solely through an ad hoc, iterative investigation of monitoring data. If the only data you have access to is the metrics you gathered (because you could anticipate they would be useful), then when facing novel problems, your investigations would quickly hit a brick wall. This is why companies are starting to turn to structured events.
Structured events are essentially collections of key-value pairs your service publishes that describe what that service is doing. This may sound familiar: the events from the event-driven architectures you read about in Part 9 are structured events; the structured logs from earlier in this blog post are structured events; and you could even publish all the types of metrics you read about earlier in this blog post as structured events. The idea is to instrument your services to publish structured events that contain all the interesting data about that service and to set up tooling to consume these events, and store them in such a way that you can efficiently analyze what’s happening in your system. What sort of tooling is that?
Note that structured events have many dimensions (many key-value pairs): e.g., what time the event happened, what service the event happened in, what upstream service called this one, what host the service was running on, the ID of the user who was accessing that service, and so on. Moreover, many of these dimensions have a high cardinality, which is a measure of how many distinct values a dimension can have. For example, the user ID dimension could be set to millions of different values, depending on how many users you have in your system. So you need tooling that can efficiently store and analyze data with high dimensionality and cardinality.
I haven’t found a widely-accepted name for this sort of tooling—I’ve heard "observability platform," "application visibility platform," "software debugging tool," and others—so for the purposes of this blog post series, I’ll use the term observability tooling specifically to refer to tools for storing and analyzing structured event data with high dimensionality and cardinality. Honeycomb released one of the first publicly-available observability tools in 2016 and did a lot of the leg work to popularize the concept of observability. Since then, other observability tools have appeared on the market, such as SigNoz and Uptrace (full list), and many of the monitoring tools you saw earlier, such as Dynatrace, New Relic, and DataDog have started to add observability features (or at least, to use "observability" in their marketing).
The ability of observability tools to efficiently slice and dice data with high dimensionality and cardinality is what allows you to iteratively interrogate your systems without knowing in advance what questions you’ll need to ask. For example, let’s say latency is spiking on your website, and you don’t know why. The following is a walkthrough of a sample debugging session that shows how you might debug this issue using an observability tool:
-
You take a look at the latency heatmap in your observability tool, as shown in Figure 96 (this is a screenshot from Honeycomb, just to give you a sense of what this process might look like):
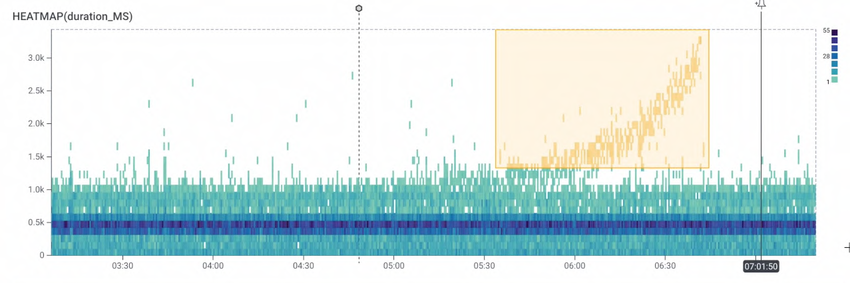 Figure 96. Using Honeycomb to debug a latency spike
 -
You select the part of the latency chart that shows the spike (the orange rectangle in the top right of Figure 96). This runs an auto-correlation that shows you what those requests have in common versus the baseline, as shown in Figure 97:
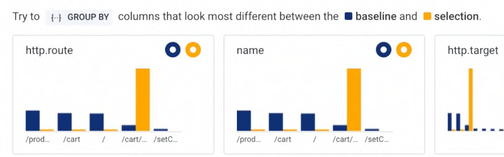 Figure 97. Correlations between the selected requests and the baseline
 -
This reveals that one HTTP route seems to be causing all the extra latency, so you click on it to filter the chart to just that single URL.
-
This runs another auto-correlation, but this time focused on that one URL. This reveals that all the slow requests correspond to a single user ID.
-
You zoom in on a single page load of when that URL was slow for that user ID. This shows that 5 service calls were made to process this request, and that 1 of those service calls represents 95% of the latency.
-
You zoom in on the slow service call to see the database queries that service call made. This reveals one query that is exceptionally slow for certain users.
While you can set up metrics and alerts ahead of time for something like latency, there’s no way to know ahead of time all the queries you would need to do in the debugging session. And even if after this incident, you added metrics and dashboards for the queries that helped resolve that incident, the next issue you have to debug will likely require totally different queries. This sort of iterative search process is where observability tools shine, as they give you the ability to find answers when you don’t know, and can’t know, what questions you’ll have to ask ahead of time.
|
Key takeaway #5
Instrument your code to publish structured events. Use observability tools to understand what your software is doing by performing iterative, ad hoc queries against these structured events. |
Another class of tools that falls under the observability umbrella are tracing tools, as discussed in the next section.
Tracing
When you have an architecture with many services, a single request from a user may result in dozens of internal requests within your architecture. For example, when your frontend service receives a request, it may send requests to services A, B, and C; service A, in turn, may send requests to services D, E, and F, while service B sends requests to services G, H, and I; and so on, as shown in Figure 98.
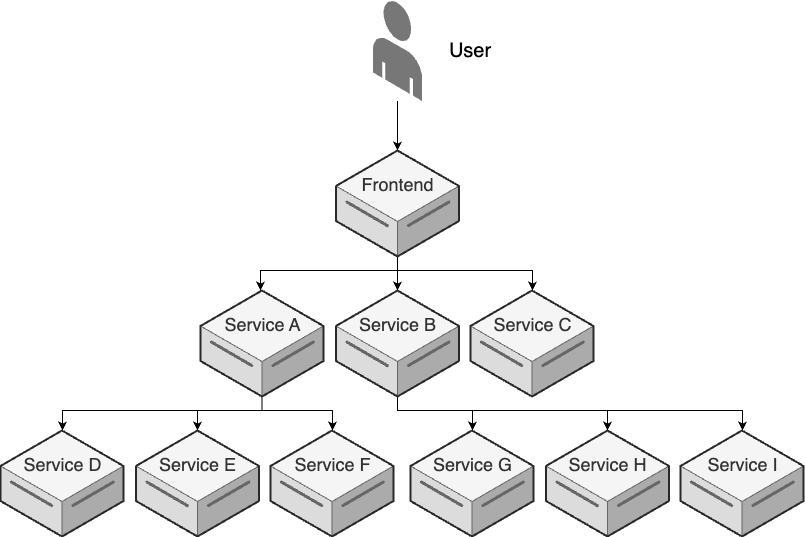
The diagram in Figure 98 is static, but in the real world, your services and request flows are going to be changing all the time, and beyond a certain scale, understanding the request flow, and debugging problems within it, can become a serious challenge. To solve this problem, many companies turn to distributed tracing, which is a method of tracking requests as they flow through a distributed system.
The basic idea is that when you get the request that initiates the flow, such as a user’s request to a frontend, you instrument your code to assign a unique ID to that request, called a trace ID, and you propagate that trace ID throughout all the downstream requests. Each of your services can then publish structured events that include the trace ID, along with other useful data such as a timestamp and how long the request took to process, and a distributed tracing tool can stitch all these events back together. That way, for every request, you can get a waterfall diagram similar to Figure 99:
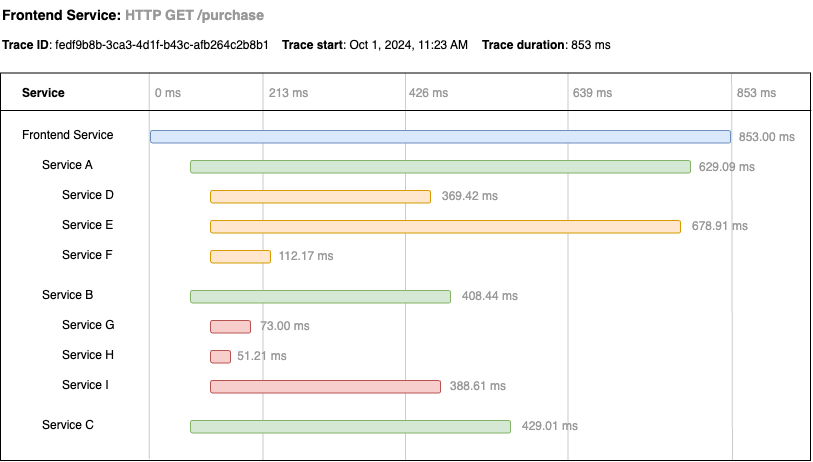
Waterfall diagrams consists of a series of nested spans, one for each request, which show you which services were involved, the order of requests (which reveals dependencies between services), how long the requests took, and other useful metadata. These sorts of diagrams help with debugging problems and performance tuning in a microservices architecture.
There are a number of tools available for instrumenting your code and collecting and analyzing distributed traces. Several of these tools focus primarily on distributed tracing, including Zipkin and Jaeger (full list). Many of the observability tools I mentioned earlier (e.g., Honeycomb, ServiceNow Observability, SigNoz, Uptrace) also have first-class support for tracing. Finally, many existing monitoring tools added varying levels of support for distributed tracing as well (e.g., Grafana, Dynatrace, New Relic, and Datadog).
These days, using OTel is often the best approach, as it’s open source, works with many different programming languages, orchestration tools, and metrics backends, and it’s a single toolkit you can use to collect all your telemetry data (i.e., metrics, logs, and traces). Also, as you saw in Part 7, some service mesh tools provide distributed tracing out-of-the-box, such as Istio, which uses OTel under the hood.
|
Key takeaway #6
Use distributed tracing to visualize the path of requests through your microservices architecture. |
You’ve now seen a number of tools for understanding what’s happening in production. If you get good enough with these tools, that opens the door to an approach known as testing in production, which is the focus of the next section.
Testing in Production (TIP)
Usually, testing checks a very strong notion of correctness on a few cases, and monitoring checks a very weak notion of correctness under the real production load.
One way to think of monitoring is as the yin to the automated testing yang. That is, you use automated tests to catch some types of errors, and you use monitoring to catch other types. Automated testing is great for catching errors when (a) you can anticipate the error and (b) you can simulate production sufficiently to replicate the error. As you saw in the observability section, as your company scales, you’ll hit more and more errors that you can’t anticipate. Similarly, as your company scales, you’ll find it harder and harder to simulate production. If you ever get to the scale of a Google or Facebook, where you have billions of users and petabytes of data, there’s just no practical way to have a faithful copy of production.
As a result, some larger companies don’t bother. That is, they don’t have staging environments. Instead, they do what has been called testing in production (TIP), where you test your software by deploying it to production, and seeing what happens. This may sound reckless and dangerous, and if not done correctly, it can be. However, the reality is that we all test in production to some extent: every deployment, every configuration change, every single user request is a test. It might work, or might hit a bug. The idea with TIP is that, at a certain scale, the effort to do automated testing in pre-production environments becomes so high, that you may actually be better off investing that effort into making your production systems more resilient. Instead of spending thousands of hours trying to catch every bug with automated tests, you spend some of that time reducing the impact of bugs.
This doesn’t mean you throw all automated testing out the window, and just thoughtlessly start tossing untested code into production while screaming Leeeeeeerooooooy Jenkins. If anything, TIP requires more discipline to do well, including the following:
- Automated testing
-
You still need plenty of automated tests to try to catch issues before they hit production, just as you saw in Part 4, including static analysis, unit tests, integration tests, etc. However, at scale, you replace some of your integration, end-to-end, and performance testing with TIP.
- Automated deployments
-
In order to test in production, your deployment process must be completely automated, as you saw in Part 5, and fast, so you can roll back or forward quickly in case of problems. Ideally, you do canary deployments as well, to limit the blast radius in case things go wrong.
- Metrics
-
As you saw earlier in this blog post, you should be keeping track of key metrics (e.g., the four golden signals) and ensuring you have a good baseline for what "normal" looks like. That way, if the code you’re testing in production causes problems, you can spot it quickly, as the metrics will no longer look normal.
- Observability and tracing
-
Testing in production depends heavily on your system being highly observable, and having distributed tracing in place, so if something goes wrong, you can quickly interrogate your system to figure out the cause, and apply a fix.
- Feature toggles, ramping, and A/B tests
-
One of the key ideas with testing in production is that you don’t test with all users. Instead, as you saw in Part 5, you limit the blast radius by wrapping each new piece of functionality in a feature toggle, so it’s off by default, and you turn it on only for a small percentage of users, perhaps just company employees initially. If the feature works well, then you gradually ramp it up, starting with a tiny percentage of users, and increasing the percentage over time so long as you don’t hit problems. Moreover, you may wish to A/B test your new code versus the original code, which requires not only that you’re gathering metrics, but that you can also slice and dice your metrics based on the feature bucket (A or B) the user was in. That way, you’re not only testing that your code works, but also that it produces better outcomes for your customers and your business, which is arguably the most important test you can do in production!
If you do TIP correctly, you’ll see significant improvements in all your DORA metrics. Deployment frequency will go up and lead times will go down, as deploying will be something every team does dozens of times per day as part of their normal coding process, rather than only at the end. Also, change failure rates and recovery time will go down, as your tooling will be designed to limit the blast radius and quickly recover from errors.
That said, testing in production is not without risks and challenges. For each feature you work on, you will constantly need to balance how much time you invest in testing before production versus how much testing you want to do in production. When the cost of bugs is high, you’ll want to lean more heavily towards automated testing before production, such as for the following types of features:
- Security features
-
If you get authentication, authorization, or encryption wrong, you can put your customer data and your entire business at risk.
- Financial features
-
Getting financial transactions wrong, such as accidentally charging a customer multiple times or zero times for what should be a single transaction, can be very costly (literally) for your business.
- Data storage features
-
A risk with data storage is that you accidentally corrupt or delete your data. With a good backup strategy, as you saw in Part 9, it’s possible to recover from such accidents, but not without an outage and loss of customer trust.
- Features where human lives are at risk
-
If you are building medical software, or autopilot, or anything else where human lives are at risk, every single bug can lead to tragedy and tremendous loss.
For these sorts of features, do as much testing before production as you possibly can. On the other hand, when the cost of bugs is low, you’ll want to lean more heavily towards testing in production. For example, if an employee at Facebook is testing in production, and that leads to a bug that breaks the news feed for a small number of users, it’s just not that big of a deal. For this very reason, Facebook’s motto used to be "move fast and break things." They eventually changed this motto to "move fast with stable infra," which in some ways, does an even better job of encapsulating the TIP philosophy of speed and resiliency.
That said, things will go wrong even with the most resilient systems, and when they do, you’ll want to be alerted about it. This is the focus of the next section.
Alerts
Logs, metrics, and events are useful for understanding the cause of an incident, but how do you find out that an incident happened in the first place? You probably don’t want to rely on a developer just happening to look at the right metric, and you definitely don’t want to wait for your users to complain. Instead, just about all the logging, metrics, and events tools you saw earlier in this blog post allow you to configure alerts that notify you of problems. In the next several sections, we’ll go through the following topics related to alerts:
-
Triggers
-
Notifications
-
On-call
-
Incident response
Let’s start by looking at what sorts of events can trigger an alert.
Triggers
The idea with alerts is to define triggers or rules for when a notification should be sent to someone. You typically define triggers in terms of various metrics, events, or logs exceeding one of the following types of thresholds:
- Absolute threshold
-
Absolute thresholds are based on specific, concrete values. Example: trigger an alert when the average latency exceeds 500 ms. These are usually the first type of trigger you turn to, as they are easy to understand and supported in virtually all monitoring tools. They are especially useful for metrics where there are unambiguous "bad" values, such as free disk space dropping to zero. However, not all metrics are this clear. For example, what’s a "bad" value for latency may depend on the product, the time of day, the time of year, and many other factors that may change as your business grows. If you have a good understanding of what "normal" is for your metrics, you can use absolute thresholds, but it’s easy to get these wrong and end up with a lot of false positives, which are alerts that go off even though there isn’t anything wrong. This can quickly lead to alert fatigue (a topic you’ll learn more about later in this blog post), so you’ll also need to use the other two types of thresholds discussed next.
- Relative threshold
-
Relative thresholds are based on comparison to a baseline value. Example: trigger an alert when latency increases by more than 50%. Relative thresholds don’t require you to specify a single, absolute value for "normal." Instead, they help you catch spikes, which in certain cases, can be a clear sign of problems.
- Historical threshold
-
Historical thresholds are based on comparisons to the same metric at a comparable previous point in time. Example: trigger an alert if the latency today is 50% higher than the latency at the same time last week. Historical thresholds are especially valuable for business that have repeated traffic patterns, such as seasonal fluctuations in an ecommerce businesses.
Once you’ve defined a bunch of triggers, the next question is what to do when a trigger goes off. Whenever possible, the default action should be to deal with it using automation, such as auto healing (e.g., replace a server or container) or auto scaling (e.g., scale the number of servers or containers up or down). If you can’t handle a trigger automatically, the next step is to notify a human, as discussed in the next section.
Notifications
Although this entire section is about alerts, the reality is that you should use alerts sparingly. I’m specifically referring to the kinds of alerts that notify a person, interrupting whatever they are doing, such as an alert on a pager or, as is more common these days, a smartphone. Alerts of this kind have a significant cost. First, they interrupt work. I’ve seen some companies where alerts go off all the time, so their operations team never has time for anything other than "fire fighting." Second, they interrupt personal life. Since alerts may come up at any time—in the middle of dinner, in the middle of the night, or during your Christmas holiday—they can significantly interfere with your personal life.
If alerts go off too often, your team will experience alert fatigue, where they will become stressed, unproductive, and unhappy. In the best case, they’ll start to ignore alerts, like in The Boy Who Cried Wolf parable. In the worst case, your team members will burn out and leave. To avoid alert fatigue, you should only use an alert if the trigger meets all the following criteria:
- It’s actionable
-
There’s no point in alerting a person if they can’t do something about the alert.
- It’s important
-
Even if it’s actionable, there’s no point in alerting a person if it isn’t important. For example, CPU usage being higher than normal probably doesn’t merit an alert, whereas an outage of your entire product probably does.
- It’s urgent
-
Even if it’s actionable and important, you shouldn’t alert someone unless it’s urgent and must be dealt with immediately. Think of alerts as a signal to your team to drop everything, and investigate immediately. For most problems, it’s OK to wait a few hours, so alerts should only be used when waiting will cause significant harm to your customers or your business.
If a trigger doesn’t meet all of these criteria, then instead of an alert, you should send a non-urgent notification, such as filing a ticket in an issue tracking system or sending a message to a chat room (e.g., in Slack or Teams) or mailing list that your operations team checks from time-to-time. That way, you know someone will see and investigate the issue, without forcing them to drop everything to do it.
|
Key takeaway #7
Use alerts to notify you of problems, but only if those problems are actionable, important, and urgent. |
If a trigger does meet all of these criteria, then you send an alert, typically to the team members who are on-call, as per the next section.
On-Call
When you’re a tiny startup, if there’s an incident, you might alert everyone. As you grow, this becomes inefficient and counter-productive, so it’s more common to have an on-call rotation, where you create a schedule that assigns specific team members to be responsible for responding to alerts at specific times. In the past, you might have managed the on-call rotation with a spreadsheet and had the on-call team members carry pagers, but these days, it’s more common to use dedicated software to manage the rotation and send alerts to smartphones. Some of the major players in this space are PagerDuty and Opsgenie (full list).
Being on-call is stressful, so here are a few practices to consider:
- Measure toil
-
Toil is work that is manual, repetitive, reactive, and temporary in nature, as opposed to engineering, where you proactively automate something to create a reusable, long-term solution. For example, if every few days, you have to fix outages due to botched manual deployments, that’s toil. If you then take the time to automate your deployment process, that’s engineering. A good practice is to try to estimate what percentage of time each team spends on toil versus engineering—this can even be a metric you track on a dashboard—and to proactively shift the balance towards engineering. No team should be spending more than ~50% of its time on toil; ideally, you can get toil for all teams below 20%.
- Set an error budget
-
There is often a tension between development and operations teams, where developers want to deploy more often to ship new features, but operations wants to deploy less often, as deployments are the most common cause of outages (see Table 11) that wake operations up at 3 AM. One way to resolve this tension is to establish an error budget, which is one minus the availability you’re targeting: e.g., if you’re targeting 99.9% availability, your error budget is 0.1%, or about 10 minutes per week. The idea is that, as long as you’re staying within your error budget, you deploy as often as you can, and any outages you hit are not seen as failures to avoid, but as an expected part of the development process. If you exceed your budget, then you slow down new feature development, and have everyone invest in making your software more resilient (through the techniques you’ve learned in this blog post series!), until you can consistently stay within your error budget.
- Include developers in the on-call rotation
-
Another way to resolve the tension between development and operations teams is to include developers in the on-call rotation. This is a quick way to squash the "throw it over the wall" mentality. After devs have been woken up a few times at 3 AM, they’ll start to write their code a bit differently, investing more in automated testing, feature toggles, monitoring, and so on.
- Recognize those who resolved incidents
-
Even if you do all the preceding items, you’ll still have outages, alerts, and stress. One way to ease the pain a little bit is to recognize employees who successfully resolved incidents, especially in response to an alert outside normal work hours. For example, you could call out their efforts in front of their peers, automatically give them a day off after a late night of fire fighting, or even offer a small monetary bonus. It should be just enough to clearly acknowledge that being on call is tough, and that you appreciate the sacrifice, but not so much that you’re incentivizing team members to create incidents (e.g., to earn major bonuses). In other words, team members should still prefer that no incident happened at all, but the recognition should take some of the sting out of it.
|
Key takeaway #8
Use an on-call rotation to deal with alerts, but make sure to keep toil in check, enforce an error budget, include developers in the rotation, and recognize those who resolved incidents. |
If you’re on-call, and an alert goes off, you’ll need to resolve the incident by going through an incident response process, as defined in the next section.
Incident Response
Whenever there is an incident, your team should follow an incident response plan, which details the steps to resolve that issue. In small startups, this is often an ad hoc process, but as your company grows, you’ll want to get the plan down in writing; in fact, this is a requirement of many compliance standards (e.g., SOC 2). This gives your on-call teams a systematic, repeatable way to resolve incidents, which should give them more confidence and allow them to resolve issues faster (as compared to, say, randomly pushing buttons and hoping it works). Every incident response plan is different, but most plans will include the following items:
- Response team
-
Define who is going to be responsible for dealing with different types of incidents. This includes the on-call rotation, plus escalation paths for various types of issues: e.g., if there is a security incident, contact the security team.
- Response time
-
Depending on the type of incident, you may have internal or customer-facing SLOs to meet. These should be clearly defined and visible so that everyone dealing with the incident knows how much time they have to resolve the issue.
- Communication channels
-
You may want to define how the response team will communicate with all relevant stakeholders, including both other internal teams, and external parties such as customers, investors, the media, and so on. This may include a combination of emails, chat rooms, wiki pages, status pages, social media accounts, and so on. It’s especially important to have a well-defined place where the response team takes notes (e.g., a wiki), documenting the steps they are taking to resolve the incident. These notes form the basis for playbooks, contingency plans, and postmortems, as described next.
- Playbooks and contingency plans
-
Many companies create playbooks and contingency plans, which specify step-by-step instructions for how to approach specific types of problems. For example, you may have one playbook for dealing with latency problems in service A and another playbook for debugging memory issues in service B. These playbooks are usually the result of documenting how a previous incident was resolved, and it’s a good idea to create them using collaborative tools such as a wiki, so that each time you use a playbook, you can update it to make it even better.
- Blameless postmortem
-
After an incident has been resolved, you may want to do a postmortem, which is a process where you get the relevant stakeholders together to discuss and document what went wrong, how you resolved it, and what you can do better in the future. Failures happen; the point of a postmortem is to learn from them. In particular, you should do blameless postmortems, where you avoid blaming individuals, and instead look for systematic causes and solutions. With the vast majority of software incidents, it’s the system and processes that are at fault, and not any one person. Even if an intern accidentally deleted your production database, the fault isn’t really with the intern, but with the fact that your system allows an intern to access the production database, with enough power to be able to delete it, and without any review or testing. If you blame people, then postmortems will mostly be CYA (cover your ass) activities; if you do blameless postmortems, then your organization can continuously learn and improve.
- Update alerts
-
Every time you resolve an alert, you should ask whether that alert identified a problem that was (a) actionable, (b) important, (c) urgent. If not, you should immediately update or delete that alert. You will never get alerts right the first time, the second time, or really, ever, because everything is constantly changing, including your software, infrastructure, products, user behavior, and so on. As a result, you’ll need to develop the discipline to tweak your alerts as part of the response process, always looking for the right balance between being notified early enough while minimizing alert fatigue.
- Update automation
-
Every time you resolve an alert, you should also ask if there is automation you can add to resolve the problem in the future without having to alert a human. For example, if there are frequent alerts related to higher latency, could you use auto scaling to automatically increase the available resources during high traffic events, thereby keeping latency at reasonable levels, without any person having to take action? In other words, each time you respond to an alert, consider if this is a place where you can do some engineering to reduce toil.
|
Key takeaway #9
Resolve incidents by assembling a response team, keeping stakeholders updated, fulfilling SLAs and SLOs, and following playbooks. After each incident, do a blameless postmortem and update your alert settings. |
Now that you’ve seen the basics of alerts, let’s try an example using CloudWatch.
Example: Alerts in CloudWatch
Earlier in this blog post, you created an asg-sample module that deployed an ASG with an ALB,
Route 53 health checks, and a CloudWatch dashboard with some metrics. Let’s set up an alert for one of those
metrics—the Route 53 health check—using
CloudWatch alarms. You’ll want
the trigger to go off when the HealthCheckStatus metric drops below 1, as that indicates the website is down.
When the trigger goes off, it will publish a message to Amazon Simple Notification Service
(SNS), and you can subscribe to SNS to get notifications via email or SMS.
Add a CloudWatch alarm to main.tf in the asg-sample module as shown in Example 193:
provider "aws" {

  region = "us-east-1"                                        (1)

  alias  = "us_east_1"

}


resource "aws_cloudwatch_metric_alarm" "sample_app_is_down" {

  provider = aws.us_east_1                                    (2)


  alarm_name          = "sample-app-is-down"                  (3)


  namespace           = "AWS/Route53"                         (4)

  metric_name         = "HealthCheckStatus"

  dimensions = {

    HealthCheckId = aws_route53_health_check.example.id

  }


  statistic           = "Minimum"                             (5)

  comparison_operator = "LessThanThreshold"

  threshold           = 1

  period              = 60

  evaluation_periods  = 1


  alarm_actions       = [aws_sns_topic.cloudwatch_alerts.arn] (6)

}


resource "aws_sns_topic" "cloudwatch_alerts" {

  provider = aws.us_east_1


  name = "sample-app-cloudwatch-alerts"                       (7)

}
Here’s what this code does:
| 1 | All Route 53 health check metrics are sent to the us-east-1 region, no matter where the actual resources are
deployed (in this case, everything else was deployed to us-east-2), so this code configures an additional
provider block to allow OpenTofu to make API calls to us-east-1. |
| 2 | This configures the CloudWatch alarm to use the us-east-1 provider so that it can look up the Route 53 health
check metrics in that region. You’ll see similar a provider configuration on the SNS topic in (7). |
| 3 | The CloudWatch alarm will be called "sample-app-is-down." |
| 4 | The alarm will check the HealthCheckStatus metric for the Route 53 health check you created earlier in this
blog post. |
| 5 | The alarm will check the minimum value of the HealthCheckStatus metric every 60 seconds, triggering if the value
drops below 1. |
| 6 | When the trigger goes off, it’ll publish a message to the SNS topic in (7). |
| 7 | Create an SNS topic called "sample-app-cloudwatch-alerts." |
To make it easier for you to test out this alarm, you can also update the asg-sample module to automatically
subscribe you to the SNS topic as shown in Example 194:
resource "aws_sns_topic_subscription" "sms" {

  provider = aws.us_east_1


  topic_arn = aws_sns_topic.cloudwatch_alerts.arn (1)

  protocol  = "email-json"                        (2)


  # TODO: fill in your own email address

  endpoint  = "USERNAME@DOMAIN.COM"               (3)

}
The preceding code does the following:
| 1 | Subscribe to the SNS topic you created earlier for CloudWatch alerts. |
| 2 | Use the "email-json" protocol, which will send out notifications in the form of emails with a JSON body. It would be more realistic to use the "sms" protocol here to get text messages, but this requires extra setup steps, and results in extra charges, both from AWS, and your cell phone provider. SNS also supports several other protocols for notifications, such as "email" (which sends notifications as plaintext emails, which are easier to read, but I ran into subscription issues with them), "http"/"https" (which sends notifications to an arbitrary HTTP/HTTPS endpoint), and "lambda" (which sends notifications to a lambda function). |
| 3 | You need to fill in your email address here to receive notifications. |
Run apply to deploy these changes:
$ tofu applyAfter a minute or two, you’ll get an email confirming your SNS subscription. Make sure to click the link in the Subscribe URL. Now that you’re subscribed, and the alarm is deployed, let’s see if it works. To do that, you need to do something fun: break your own sample app! You can get creative with how you do this. One option is to go into the AWS Load Balancers Console, select the sample-app ALB, and click Actions > "Delete load balancer." After a few minutes, the Route 53 health checks should start failing, and you should get an email similar to Figure 100:
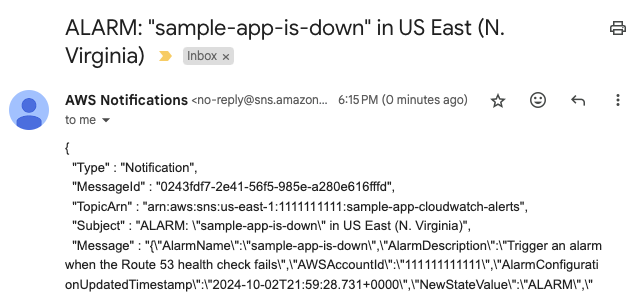
If you see an email with subject "ALARM: sample-app-is-down," then congrats, alerts are working! You now have a way to monitor your software 24x7, and to be notified as soon as anything goes wrong.
|
Get your hands dirty
Here are a few exercises you can try at home to go deeper:
|
If you want to fix the alert you’re seeing, you can run apply one more time to redeploy whatever infrastructure
you destroyed. If you’re done testing, commit your latest code to Git, and then run destroy to clean everything up.
Conclusion
You’ve now seen how to monitor your systems, as per the 9 key takeaways from this blog post:
-
Add logging throughout your code to give you visibility into what’s happening in your systems.
-
Use log levels, log formatting, multiple loggers, structured logging, log file rotation, and log aggregation to make your logging more effective.
-
Use metrics to detect problems, understand user behavior, improve product and team performance, and more generally, as a mechanism for continuous feedback and improvement.
-
Collect multiple types of metrics (availability, business, application, server, team) and build dashboards to focus on the most important metrics to your business.
-
Instrument your code to publish structured events. Use observability tools to understand what your software is doing by performing iterative, ad hoc queries against these structured events.
-
Use distributed tracing to visualize the path of requests through your microservices architecture.
-
Use alerts to notify you of problems, but only if those problems are actionable, important, and urgent.
-
Use an on-call rotation to deal with alerts, but make sure to keep toil in check, enforce an error budget, include developers in the rotation, and recognize those who resolved incidents.
-
Resolve incidents by assembling a response team, keeping stakeholders updated, fulfilling SLAs and SLOs, and following playbooks. After each incident, do a blameless postmortem and update your alert settings.
If you’re starting from zero with monitoring, figuring out all the instrumentation and tooling may seem like a daunting task, but bear in mind that you can do this incrementally. You don’t have to monitor everything, and you don’t need the perfect monitoring setup from day one, to get value out of monitoring. In fact, you usually get the most bang-for-the buck from the initial few items you set up, and then diminishing returns with more elaborate methods. Start small, perhaps by adding some basic logging, and tracking a handful of metrics (e.g., availability metrics plus the four golden signals), and then iteratively add more as you scale.
I’d also recommend being especially liberal with structured logging (as long as you use multiple loggers and log levels) and with structured events, as it’s relatively cheap to instrument your code with these, and you’d be surprised how often this data will come in handy for debugging and analysis. I’ve rarely felt like I had too much monitoring data, but there have been many incidents where, after hours debugging some thorny issue, I found myself desperately wishing I had more logging and event data to work with.
At this point in the blog post series, you’ve learned just about all the basics of DevOps and software delivery as they are today. Let’s now turn to Part 11 to imagine what DevOps and software delivery might look like in the future.
Update, June 25, 2024: This blog post series is now also available as a book called Fundamentals of DevOps and Software Delivery: A hands-on guide to deploying and managing software in production, published by O’Reilly Media!
