Part 7. How to Set Up Networking
Update, June 25, 2024: This blog post series is now also available as a book called Fundamentals of DevOps and Software Delivery: A hands-on guide to deploying and managing software in production, published by O’Reilly Media!
This is Part 7 of the Fundamentals of DevOps and Software Delivery series. In Part 6, you learned how to split your deployments into multiple environments and how to split your codebase into multiple services. Both of these items rely heavily on networking: namely, services need to be able to talk to other services over the network, and environments need to be isolated from each other so they can’t talk to each other over the network. In other words, networking plays two key roles: connectivity and security.
In this blog post, you’ll go deeper into networking, learning the high-level networking concepts you need in order to connect and secure your applications. In particular, this post will walk you through the concepts and examples shown in Table 13:
| Concept | Description | Example |
|---|---|---|
|
Public networking |
Manage access to your apps over the public Internet with public IPs and domain names. |
Deploy servers with public IPs in AWS and register a domain name for them in Route 53. |
|
Private networking |
Run your apps in a private network to protect them from public Internet access. |
Create a Virtual Private Cloud (VPC) in AWS and deploy servers into it. |
|
Network access |
Learn to how to securely access private networks using SSH, RDP, and VPN. |
Connect to a server in a VPC in AWS using a bastion host and SSH. |
|
Service communication |
Connect and secure communication between apps in a microservices architecture. |
Use Istio as a service mesh for microservices running in Kubernetes. |
Let’s start with the first item, which is public networking.
Public Networking
Just about everything you’ve deployed so far in this blog post series has been
accessible directly over the public Internet. For example, you were able to access
the EC2 instance you deployed in
Part 1 using a public IP address like
3.22.99.215 and the load balancer you deployed in
Part 3 using a domain name like
xx.us-east-2.elb.amazonaws.com. Where did that IP and domain name come
from, and how do they work? That’s the focus of the next two sections,
starting with public IPs.
Public IP Addresses
Just about the entire Internet runs on top of the Internet Protocol (IP), which is a set of rules for how to route and address data across networks. The first major version of IP, IPv4, which has been around since the 1980s, is the dominant protocol today. Its successor, IPv6, started rolling out around 2006, and is gradually gaining adoption.
IP addresses are a central part of IP: each address (a) identifies one
endpoint on the network and (b) specifies the location of the endpoint on the
network, so you can route traffic to it. IPv4 addresses are 32-bit numbers which
are typically displayed as four groups of two decimal digits, such as
11.22.33.44. With only 32-bits, the number of possible unique IPv4
addresses is 232, or roughly 4 billion, which is a problem, as
we’ve had far more than 4 billion Internet-connected devices for a long
time.[30]
Running out of IPs is one of the reasons the world is moving to IPv6, which uses
128-bit addresses that are typically displayed as eight groups of four hexadecimal
digits, such as 2001:0db8:85a3:0000:0000:8a2e:0370:7334. With 128-bit
addresses, the number of possible unique addresses is 2128, or roughly
340 undecillion (340 followed by 36 zeros), which is unlikely to ever run out.
Unfortunately, IPv6 adoption world-wide is still under 50%.[31]
Many older networking devices don’t support IPv6, so adoption takes a long
time, as it requires updating software and hardware across thousands of devices
and networks around the world. Therefore, most of what you do with networking for
now, and most of what this blog post will focus on, will be IPv4.
How do you get a public IP address? The Internet Assigned Numbers Authority (IANA) owns all public IP addresses and it assigns them in a hierarchical manner. At the top level, IANA delegates blocks of IP addresses to Internet registries that cover specific regions of the world. These registries, in turn, delegate blocks of IP addresses to network operators within their region, such as Internet Service Providers (ISPs), cloud providers (e.g., AWS, Azure, Google Cloud), enterprise companies, and so on. Finally, these network operators assign IPs to specific devices. For example, when you sign up for an Internet connection at home with an ISP, that ISP assigns you an IP address from its block of IPs; when you deploy EC2 instances in AWS, AWS assigns you an IP address from its block of IPs.[32]
|
Key takeaway #1
You get public IP addresses from network operators such as cloud providers and ISPs. |
IP addresses are a fundamental building block of the Internet, and they work well for computers talking to other computers, but they aren’t particularly human-friendly. If the only way to access your servers was to memorize a bunch of random numbers that may change from time to time, the Internet and World Wide Web probably wouldn’t have made it very far. Fortunately, we have the Domain Name System, which is the topic of the next section.
Domain Name System (DNS)
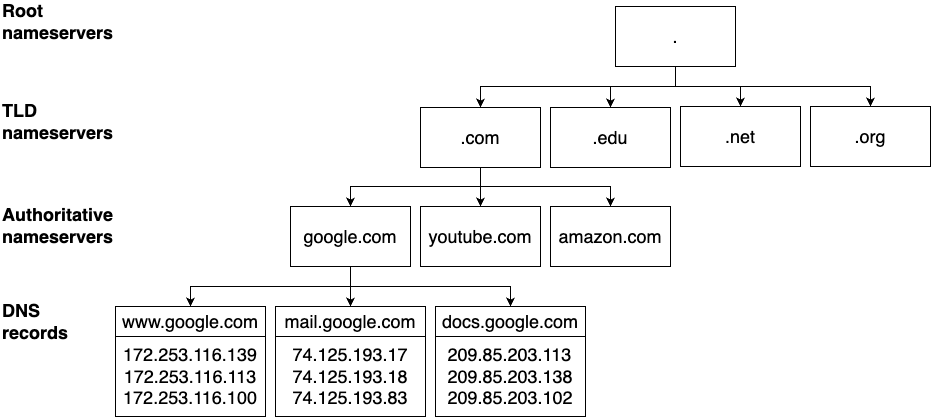
The Domain Name System (DNS) is a service that allows you to use a
memorable, consistent, human-friendly domain name, instead of an IP
address, to access a web service. For example, you can use
www.google.com instead of
172.253.116.139 to access Google’s servers. DNS stores the
mapping from names to IP addresses in a globally-distributed hierarchy of
nameservers, as shown in Figure 56.
When you enter a fully-qualified domain name (FQDN) such as
www.google.com into your web browser, here is how that FQDN is
resolved:
-
Your computer sends a request to a local DNS resolver. At home, your ISP typically configures itself as the DNS resolver; in the cloud, the cloud provider typically configures itself as the DNS resolver.
-
The DNS resolver makes a series of queries to the hierarchy of nameservers. It processes the FQDN in reverse order, as per the following steps.
-
Query the root nameservers for the top-level domain (TLD). The root nameservers are managed by IANA, running at 13 known IP addresses that are hard-coded into most DNS resolvers, and they respond with the IP addresses of the TLD nameservers for that TLD (e.g.,
.com). -
Query the TLD nameservers for the second-level domain (SLD). The TLD nameservers are also managed by IANA, and they respond with the IP addresses of the authoritative nameservers for that SLD (e.g.,
google). -
Query the authoritative nameservers for the subdomain. The authoritative nameservers are operated by a variety of companies, such as Amazon Route 53, GoDaddy, and Namecheap (full list), and they respond with the DNS records for that subdomain (e.g.,
www). There are many types of DNS records, each of which stores different kinds of information. For example, DNS A records and DNS AAAA records are "address" records that store IPv4 addresses and IPv6 addresses, respectively; DNS CNAME records are "canonical name" records that store aliases for a domain name; and DNS TXT records are "text records" that can store arbitrary text.
-
-
Your computer uses the IP addresses in the DNS records. Your browser typically looks up DNS A or AAAA records, and when it gets them back, it uses the IP addresses within them to finally fetch the website you requested.
Going through so many rounds of requests to get some DNS records may seem inefficient, but DNS is typically pretty fast, and there is a lot of caching along the way (e.g., your browser, OS, and DNS resolver may cache records for some period of time to reduce the number of lookups).
|
Key takeaway #2
DNS allows you to access web services via memorable, human-friendly, consistent names. |
So that’s how DNS records are looked up, but how do they get there in the first place? Who decides who owns what domain? As with most things related to the Internet, this also goes back to IANA, which owns and manages all domain names. IANA delegates the management of these domain names to accredited registrars, who are allowed to sell domain names to end users. The registrars are often (but not always) the same companies that run authoritative name servers, such as Amazon Route 53, GoDaddy, and Namecheap. Note that, technically, you never own a domain name. You can only lease it, for which you pay an annual fee. If you stop paying that fee, the registrar can lease it to someone else.
Once you lease a domain name, you then have permissions to configure the DNS records for that domain in its authoritative nameservers, which allows users all over the world to access your servers via that domain name. DNS is a beautiful, scalable system, and getting your first domain name working can feel magical. Let’s try out an example of this magic by registering and configuring a domain name in Route 53.
Example: Register and Configure a Domain Name in Amazon Route 53
In this section, you’ll deploy a web app, and set up a domain name for it. We’ll use Amazon’s Route 53 as the domain name registrar and the web app will be a simple HTTP server running on several EC2 instances that respond with "Hello, World!" This involves three steps: register a domain name, deploy EC2 instances, and configure DNS records. Let’s start by registering a domain name.
Register a domain name
The first step is to register a domain name. Although you’ll manage most of your infrastructure as code in this blog post series, registering domain names involves a number of manual steps, so I typically do it using a web UI.
|
Watch out for snakes: registering domain names costs money!
While most of the examples in this blog post series are part of the AWS
free tier, registering domain names is not. The
pricing varies
based on the domain name you register. For example, as of 2024, most
|
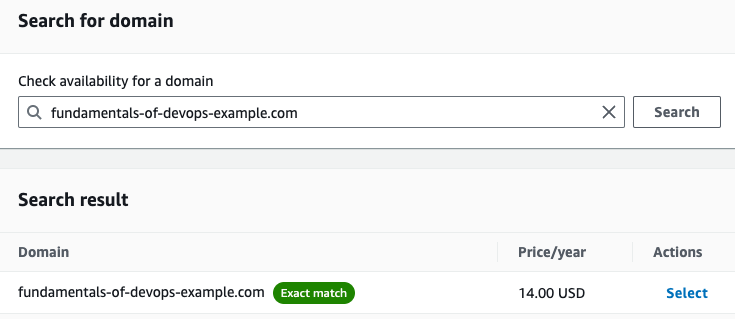
Head to the
Route 53 dashboard,
choose "Register a domain," and click "Get started." On the next page, use the
search box to find a domain name that is available for purchase. For example, as
shown in Figure 57, I found that
fundamentals-of-devops-example.com was available; you’ll want to search
for other domains, as I’ve already registered that one. Have fun with it.
You can register a variety of domain names, including standard ones like
.com, .net, and .org, but also more
unusual ones, such as .agency, .beer,
.expert, .games, .me, and
.fail, so get creative.
Once you’ve found a domain name that you like and is available, click
Select to add it to your cart, scroll to the bottom of the page, and click
"Proceed to checkout." On the next page, decide for how many years you want to
register your domain, and if you want the registration to auto-renew, and then
click Next. You’ll end up on a page where you need to fill out the contact
details for the domain. IANA requires every domain to have contact details, and
anyone can look up the contact details for any domain using whois,
as shown in Example 122:
whois to look up the contact
details for a domain
$ whois fundamentals-of-devops-example.com

Registrant Organization: Identity Protection Service

Registrant Street: PO Box 786

Registrant City: Hayes

Registrant State/Province: Middlesex

Registrant Email: f7cbd7cd-401a-44fb-xxxx@identity-protect.org

(... truncated ...)
If you want to keep your details private, at the bottom of the contact details page, you can choose to enable privacy protection to have Amazon list its own contact details on the domain, forwarding any messages about your domain to you, while keeping your contact details private. Once you’ve filled in the contact details, click Next, and you’ll see a summary page where you can review what you’re buying, agree to the terms and conditions, and click Submit to start the registration process.
The registration process takes 5 - 30 minutes, so be patient. You can monitor the process on the registration requests page. During this process, Route 53 will send a confirmation email to the address you put on the contact details page. Once you get this email, click the link within it to confirm you own the email address. When the registration process is complete, find your domain on the registered domains page, click on it, and in the Details section, you should see a number of name servers. When you register a domain in Route 53, it automatically configures its own servers as the authoritative nameservers for that domain. Route 53 also automatically creates a hosted zone for the domain, which is the container for the DNS records for that domain. You’ll see how to add DNS records to this hosted zone shortly.
Deploy EC2 instances
|
Example Code
As a reminder, you can find all the code examples in the blog post series’s sample code repo in GitHub. |
The next step is to deploy some EC2 instances to run the "Hello, World" web app.
Head into the folder where you’ve been working on the code samples for
this blog post series and create a new folder for this blog post, and within
that, a new OpenTofu root module called ec2-dns:
$ cd fundamentals-of-devops

$ mkdir -p ch7/tofu/live/ec2-dns

$ cd ch7/tofu/live/ec2-dns
Within the ec2-dns root module, you can create several EC2
instances using a module called ec2-instances, which is in the blog
post series’s
sample code repo in the
ch7/tofu/modules/ec2-instances folder. This module is similar to the
OpenTofu code you wrote in
Part 2 to deploy an EC2
instance, except the ec2-instances module can deploy multiple EC2
instances, and it allows you to specify the user data script to run (rather than
providing its own). To use this module, create a file called main.tf in
the ec2-dns
folder, with the initial contents shown in
Example 123:
provider "aws" {

  region = "us-east-2"

}


module "instances" {

  source  = "brikis98/devops/book//modules/ec2-instances"

  version = "1.0.0"


  name          = "ec2-dns-example"

  num_instances = 3                                   (1)

  instance_type = "t2.micro"

  ami_name      = "sample-app-packer-*"               (2)

  http_port     = 8080                                (3)

  user_data     = file("${path.module}/user-data.sh") (4)

}
The preceding code uses the ec2-instances module to do the
following:
| 1 | Deploy three EC2 instances. |
| 2 | Use the "sample-app-packer" AMI from Part 3, which installed Node.js, PM2, and a "Hello, World!" app. If you still have that AMI, you can reuse it. If not, see the Packer section of Part 3 for how to build it again. |
| 3 | Allow the instances to receive HTTP requests on port 8080. |
| 4 | Have each instance run the user data script described next. |
For a user data script, copy the one from the asg-sample root
module in Part 3, which uses PM2
to fire up the Node.js "Hello, World!" app:
$ cp ../../../../ch3/tofu/live/asg-sample/user-data.sh .Finally, create outputs.tf with the contents shown in Example 124 to output the public IP addresses of the EC2 instances:
output "instance_ips" {

  description = "The IPs of the EC2 instances"

  value       = module.instances.public_ips

}
Deploy as usual, authenticating to AWS, and running init and
apply:
$ tofu init

$ tofu apply
When apply completes, you should see the IP addresses of the
instances in the instance_ips output variable:
instance_ips = [

  "3.145.172.12",

  "18.118.205.155",

  "18.224.38.87",

]
Give the instances a minute or two to boot up, copy one of the IP addresses, and check that the web app is working:
$ curl http://3.145.172.12:8080

Hello, World!
Configure DNS records
Now that you have a web app running on several servers, you can point your
domain name at them by adding the code shown in
Example 125 to the
ec2-dns module:
data "aws_route53_zone" "zone" {                     (1)

  # TODO: fill in your own domain name!

  name = "fundamentals-of-devops-example.com"

}


resource "aws_route53_record" "www" {

  zone_id = data.aws_route53_zone.zone.id            (2)

  # TODO: fill in your own domain name!

  name    = "www.fundamentals-of-devops-example.com" (3)

  type    = "A"                                      (4)

  records = module.instances.public_ips              (5)

  ttl     = 300                                      (6)

}
This code adds a DNS A record to your Route 53 hosted zone as follows:
| 1 | Look up the hosted zone AWS created automatically for the domain you registered earlier. Make sure to fill in your own domain name here. |
| 2 | Create the DNS record in the hosted zone found in (1). |
| 3 |
The DNS record is for www.<YOUR-DOMAIN>. Fill in your own
domain here.
|
| 4 | This is an A record, which points to IPv4 addresses. |
| 5 | Point the A record at the IPv4 addresses of the EC2 instances you deployed. |
| 6 | Set the time to live (TTL) for the record to 300 seconds (5 minutes), which specifies for how long DNS resolvers should cache the record. Increasing the TTL will reduce latency for your users and load on your DNS server, but updates will take longer to take effect. |
Add the domain name as an output variable in outputs.tf, as shown in Example 126:
output "domain_name" {

  description = "The domain name for the EC2 instances"

  value       = aws_route53_record.www.name

}
Run apply one more time. When it completes, test your domain name,
making sure to explicitly specify http:// and port 8080
(you’ll see how to make domain names work with https:// and
without having to specify a port in
Part 8):
$ curl http://www.<YOUR-DOMAIN>:8080

Hello, World!
It seems to be working! You can get a little more insight by using the
dig command:
$ dig www.<YOUR-DOMAIN>You’ll get a bunch of output (learn more about dig output), but the key parts to focus on are the question and answer sections, which will look like this:
;; QUESTION SECTION:

;www.fundamentals-of-devops-example.com.	IN A


;; ANSWER SECTION:

www.fundamentals-of-devops-example.com.	85 IN A	3.145.172.12

www.fundamentals-of-devops-example.com.	85 IN A	18.118.205.155

www.fundamentals-of-devops-example.com.	85 IN A	18.224.38.87
The question section shows the domain name and type of record you queried. The
answer section shows the information you got back for your query, which should
be the IP addresses of your EC2 instances. If that’s what you see,
congrats, you just configured a domain name for your web app! You now have a
single, human-friendly endpoint you can give your users, which under the hood,
automatically resolves to the IP addresses of your servers. When you’re
done testing and experimenting, commit your code, and run
tofu destroy to clean everything up.
|
Get your hands dirty
Here are a few exercises you can try at home to go deeper:
|
You’ve now seen how to manage public IP addresses and public domain names, but it’s important to understand that not everything should be publicly accessible over the Internet. One reason is that there aren’t enough IP addresses in the world for everything to be public. As you saw earlier, we’ve already exhausted the IPv4 address space, while IPv6 adoption world-wide is still low. Another reason is security. Many devices are not locked down enough to be exposed publicly. As a result, a huge portion of networking is private, which is the focus of the next section.
Private Networking
Private networking is part of a defense in depth strategy, where you establish multiple, redundant layers of security. Consider the castle shown in Figure 58:

Builders of castles didn’t rely on just a single wall to keep them safe. They used multiple layers of defense, including moats, concentric walls, gates, towers, keeps, soldiers, and traps. If one layer failed, you could fall back to the others, and still stay safe. You should design your software architecture in a similar manner, with multiple layers of defense, so that if one of them fails, the others are there to keep you safe.
For example, the servers you’ve deployed so far throughout this blog post series have all been accessible over the public Internet. The only thing that kept them safe is the firewalls (security groups) which block access to all ports by default. This is a pretty thin layer of protection. All it takes is one mistake, one port open that shouldn’t be, and your servers may become vulnerable. In the real world, sooner or later, you will make a mistake. Malicious actors are scanning for open ports and other vulnerabilities all the time, and many security incidents are not the result of brilliant algorithmic code cracking, but of opportunists jumping on easy vulnerabilities due to someone making a mistake. If one person making a mistake is all it takes to cause a security incident, then the fault isn’t with that person, but with the way you’ve set up your security.
|
Key takeaway #3
Use a defense-in-depth strategy to ensure you’re never one mistake away from a disaster. |
A more secure approach is to deploy just about all of your servers into private networks, which are networks set up by organizations solely for that organization’s use, such as office, university, data center, and home networks. Typically, private networks are locked down so they can only be accessed by authorized individuals from within that organization, which has the following advantages:
- Defense in depth
-
Servers in private networks have at least two layers of protection: first, a malicious actor would have to be able to get into your private network, and second, they would then have to find a vulnerability in a server, such as a misconfigured firewall. In fact, a good private networking setup can create more than two layers, as you’ll see later in this blog post.
- Isolate workloads
-
You saw in Part 6 that there are different ways to set up environments: different servers, different accounts, different data centers, and, as is the focus of this blog post, different networks. Private networks give you a way to isolate different types of workloads. One common pattern is to deploy different products and teams in separate private networks; another common pattern is to deploy data store servers and application servers in separate private networks. You can then choose to either allow no network traffic between the different types of workloads, or only allow traffic between specific IPs and ports. Either way, this reduces the chances of one workload accidentally, or maliciously, causing problems for another workload.
- Better control and monitoring
-
Private networks give you fine-grained control over routing, including managing traffic patterns for north-south traffic, which is the traffic between your servers and the outside world, and east-west traffic, which is the traffic between servers within your network. They also allow you to configure security controls and set up monitoring, such as capturing flow logs, which show you all the traffic going through your private network.
Because of all of these advantages, private networks should be your default choice.
|
Key takeaway #4
Deploy all your servers into private networks by default, exposing only a handful of locked-down servers to the public Internet. |
In the next several sections, you’ll learn the basics of private networking by looking at physical networks in on-prem data centers and then virtual networks in the cloud.
Physical Private Networks
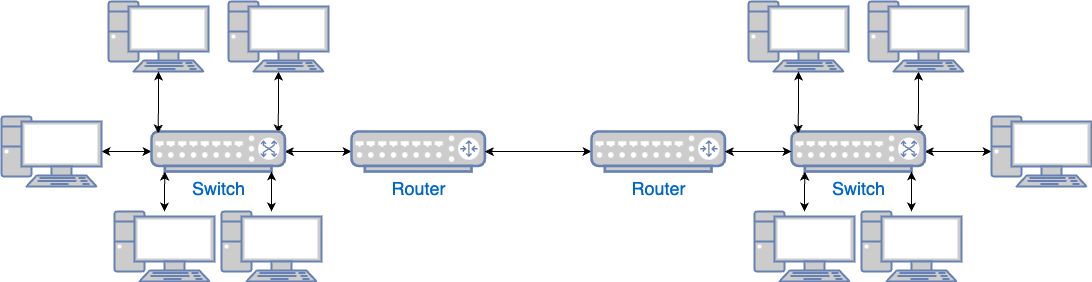
In this section, I’m going to walk you through an overview of how physical networks work. Note that networking is a huge topic, so I’ve had to compress a lot of information, and what you’re seeing here is a simplified picture that skips over some of the nuances. Let’s start by thinking through how you’d connect computers together. Connecting two computers is easy: all it takes is a single cable, as shown in Figure 59.

Connecting N computers is more complicated. If you had to connect every computer to every other computer, you’d need N2 cables, which would be messy and expensive. The solution is to connect all the computers to a single switch, a device that can forward data between computers, which only requires N cables, as shown in Figure 60:

These connected computers form a network. Connecting two networks is easy: you typically do it using routers, as shown in Figure 61.
Connecting N networks is hard, as you have that N2 problem again. The solution is to connect those routers using the Internet, as shown in Figure 62:
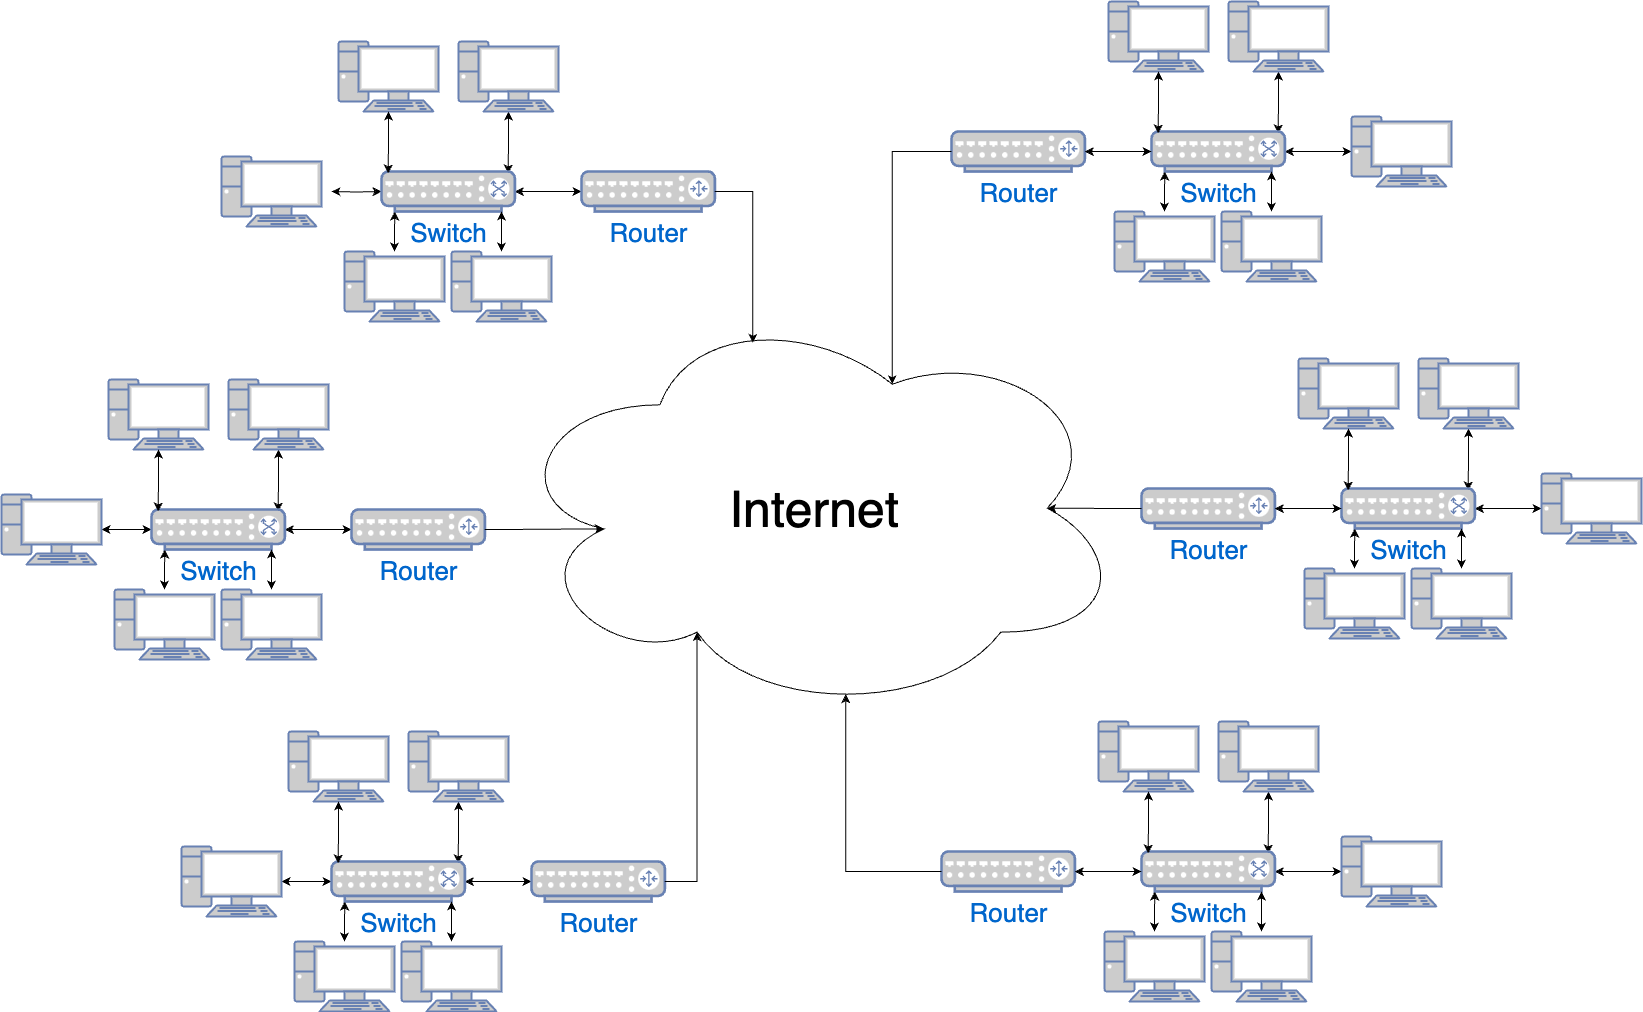
The term "Internet" is derived from interconnected networks: a network of networks. Many of those networks are private. For example, you might have a private network in your house or a private network in a data center. For your home network, you probably got a router from your ISP, which is actually both a switch and a router, and it creates a private network that allows the devices you have at home (e.g., your computer, laptop, phone, tablet, printer, TV) to talk to each other. For a data center network, the data center technicians set up various switches and routers, and this creates a private network that allows the servers in that data center to talk to each other.
Most private networks have several key characteristics:
-
Only authorized devices may connect to the private network
-
The private network uses private IP address ranges
-
The private network defines connectivity rules
-
Most devices in a private network access the public Internet through a gateway
The following sections go into detail on each of these, starting with only allowing authorized devices to connect to the private network.
Only authorized devices may connect to the private network
Whereas just about anyone can connect to the public Internet, a key characteristic of private networks is that only devices you explicitly allow may connect. For example, the only way to connect to the private network within a data center is to physically get into the data center and plug a cable into the routers and switches; the only way to connect to the private network within your house is to either physically connect to the ISP router with an ethernet cable, or if your router supports Wi-Fi, you have to be within range of the antenna, and you typically need a password.
The private network uses private IP address ranges
IPv4 reserves the following IP addresses for private networks (RFC 1918):
10.0.0.0 - 10.255.255.255

172.16.0.0 - 172.31.255.255

192.168.0.0 - 192.168.255.255
Note that you can express ranges of IP addresses more succinctly using
Classless Inter-Domain Routing (CIDR) notation, where you define
CIDR blocks of the format a.b.c.d/e, where
a.b.c.d is an IP address, and e is a decimal number
that represents how many bits of the IP address, when expressed in binary, stay
the same, so the range of IPs is defined by all the other bits that can change.
For example, 0.0.0.0/0 represents all possible IP addresses, as
zero of the bits stay the same; 1.2.3.4/32 represents just the
single IP address 1.2.3.4, as all 32 bits stay the same;
10.0.0.0/24 represents the IPs 10.0.0.0 -
10.0.0.255, as the first 24 bits stay the same, leaving the last 8
bits to change. Using CIDR notation, the three private IP address ranges from
RFC 1918 can be represented as:
10.0.0.0/8

172.16.0.0/12

192.168.0.0/16
While every public IP address must be unique, these private IPs are used over
and over again in just about all private networks, as they can only be
used for private networks. For example, if you look at your computer’s
Wi-Fi or ethernet settings while on your home network, you’ll typically
find that you have an IP address similar to
192.168.xxx.yyy. Most data center networks use
10.0.0.0/8 or 172.16.0.0/12.
The private network defines connectivity rules
In your home network, depending on your router, you can typically define a few basic connectivity rules, such as blocking outbound access to specific websites or inbound requests from specific IP addresses. In a data center network, you have full control over connectivity. For every device in the network, you can specify what IP address it gets assigned, what ports it’s allowed to use, which other devices it can talk to, and how traffic gets routed to and from that device. You control some of this behavior through hardware: namely, whether certain devices are connected via cables or not. You control the rest through software, based on the configuration in your switches and routers.
Since data centers can have hundreds or thousands of servers, it’s common to partition the private network into subnets (subnetworks) and to assign rules to subnets rather than individual devices. For example, a common approach is to run a small handful of servers, such as load balancers, in one subnet called a DMZ (demilitarized zone), which allows access to those servers directly from the public Internet, and to run the rest of your servers in another private subnet, which is not accessible from the public Internet, and is more locked down.
Most devices in a private network access the public Internet through a gateway
Devices in a private network are not accessible from the public Internet, which is great from a security perspective, but what if those devices need some limited access to the Internet (e.g., to make an API call)? One option is to assign public IP addresses to those devices. For example, you might assign a public IP address to a server in your DMZ; that means that server will have two IP addresses, one that is public, which it uses to communicate with the Internet, and one that is private, which it uses to communicate with other devices in the private network. However, trying to assign a public IP to every device in a private network largely defeats the purpose of having a private network: namely, the desire to keep those devices private and to avoid running out of IPv4 addresses.
Therefore, the vast majority of devices in a private network access the public Internet through a gateway. Here are a few of the most common types of gateways:
- Load balancers
-
One type of gateway you’ve already seen is a load balancer, which allows requests that originate on the public Internet to be routed to app servers in your private network based on rules you define in that load balancer: e.g., if a user makes a request to the load balancer on port 80 for domain
foo.com, forward the request to a specific set of app servers on port 8080. - NAT gateway
-
A Network Address Translation (NAT) gateway allows requests that originate in a private network to be routed out to the public Internet. Under the hood, many NAT gateways do port address translation (PAT). To make an API call to
some-service.com, a server in the private network sends that request to the NAT Gateway, which forwards the request tosome-service.com, modifying ("translating") the request along the way to make it look like it originated from the public IP of the NAT gateway at a specific port number. When the response comes back fromsome-service.comto that port, the NAT gateway knows which server to forward the response to, and it will translate the response to make it look like it came directly fromsome-service.com. - Forward proxy
-
A forward proxy is like a specialized NAT gateway that only allows servers to make outbound requests to a carefully-managed list of trusted endpoints. Networking is all about layers of defense, and while most of those layers keep attackers out, a forward proxy keeps them in. That is, if someone manages to get through all the other layers and break into your systems, then your last line of defense is to make it as hard as possible for them to escape with anything valuable, such as user data. Many attackers will try to send stolen data to their own servers, and the goal of the forward proxy is to block this data exfiltration.
- ISP router
-
On your home network, the router you got from your ISP typically configures itself as a NAT gateway. All the devices on your home network send all requests intended for the public Internet via the router, which uses PAT to get you a response, while keeping those devices hidden.
Gateways offer three major benefits. First, they allow devices in a private network to talk to public networks. Second, gateways hide the devices in the private network, providing a layer of protection for them, and only allowing through traffic that you explicitly permit. And third, a single gateway can share one or a small number of public IP addresses amongst thousands of devices within its private network. This is one of the ways we’ve been able to get far more than 4 billion devices onto the public Internet, despite IPv4 limitations.
Now that you’ve seen the basics of private networking in the physical world, let’s see what private networking looks like in the cloud, where everything is virtualized.
Virtual Private Networks
If you deploy into the cloud, the cloud provider has already taken care of all the physical networking for you: all the servers, switches, routers, and cables are already hooked up, largely in a way you can’t see or control. What you can control is a virtual network, which is a network you configure entirely in software (which is why it’s sometimes referred to as software-defined networking). In the following several sections, you’ll learn about virtual networks in the cloud, virtual networks in orchestration tools, and then go through an example of creating a virtual network in AWS.
Virtual networks in the cloud
Each cloud provider offers slightly different networking features, but they typically have the following basic characteristics in common:
- You can create a VPC
-
Most cloud providers allow you to create a private network called a virtual private cloud (VPC). This is the name used by AWS and Google Cloud, and the name I’ll use in this blog post series, whereas Azure calls them virtual networks (VNets).
- The VPC consists of subnets
-
Each VPC contains one or more subnets. Each subnet has an IP address range from RFC 1918: e.g.,
10.0.0.0/24. - The subnets assign IP addresses
-
The resources you deploy into a subnet get an IP address from that subnet’s IP address range. For example, if you deploy three servers into a subnet with the IP address range
10.0.0.0/24, the servers might end up with the IPs10.0.0.20,10.0.0.21, and10.0.0.22. - You enable connectivity with route tables
-
Each subnet has a route table that controls how traffic is routed. Each row in a route table typically defines a destination and where to route traffic sent to that destination. Each time the VPC needs to route a packet, it will go through the route table, and use the most specific route that matches that packet’s destination. For example, consider the route table in Table 14:
Table 14. Example route table Destination Target 10.0.0.0/16
VPC Foo
10.1.0.0/16
VPC Bar
0.0.0.0/0
NAT gateway
This route table configures all traffic to
10.0.0.0/16to go to a VPC called Foo, all traffic to10.1.0.0/16to go to a VPC called Bar, and all other traffic (0.0.0.0/0) to go to the NAT gateway (to be routed to the Internet). For a packet with the destination10.0.0.8, the most specific route that matches will be VPC Foo. For a packet with destination3.4.5.6, none of the VPC routes will match, so it will fall back to the catch-all0.0.0.0/0route, and go to the NAT Gateway. - You block connectivity with firewalls
-
Each cloud provider provides different types of firewalls to block traffic. Some firewalls apply to individual resources, such as servers, and these firewalls typically block all traffic by default. For example, as you saw in earlier blog posts, every EC2 instance in AWS has a security group, and you have to open up specific ports in that security group to allow access. Other firewalls apply to entire subnets or VPCs, and these firewalls typically permit all traffic by default, allowing you to specify what traffic to block. For example, AWS has a network firewall that you can use to filter inbound and outbound traffic across an entire VPC.
- You access the public Internet through gateways
-
Just as with a physical data center, you can run various types of gateways to allow servers in the VPC access the public Internet. For example, just about all the cloud providers offer load balancers and NAT Gateways.
Note that, to make it easier to get started, some cloud providers allow you to deploy resources without creating a VPC, sometimes by providing a default VPC (as you saw with AWS). If you want better network security and control, you have to create a custom VPC, as you’ll see later in this blog post.
Virtual networks in orchestration tools
Some orchestration tools come with their own virtual network, such as Kubernetes Networking, OpenShift Networking, and Marathon Networking. This is because many orchestration tools, especially open source ones, are designed to work in any data center or cloud, and to be able to solve the core orchestration problems from Part 3 that involve networking (e.g., load balancing, service communication) in a way that’s portable, these tools create their own virtual networks. These virtual networks are typically responsible for IP address management (assigning IP addresses to apps running in the orchestration tool), service communication (allowing the apps to communicate with each other), and ingress (allowing the apps to receive requests from the outside world).
The key thing to understand is that if you’re using an orchestration tool that has its own virtual network, then you’re going to have to integrate two sets of networking technologies: one from the orchestration tool, and one from your data center or cloud provider. Since these orchestration tools can be deployed in many different environments, they typically offer plugins to handle this integration. For example, Kubernetes supports Container Network Interface (CNI) plugins to manage cluster networking and ingress controllers to manage ingress. Table 15 shows the typical CNI plugin and ingress controller you use when deploying Kubernetes with various cloud providers, and how that allows you to integrate Kubernetes' networking (IP address management, service communication, and ingress) with that cloud provider’s networking:
| Cloud | Typical CNI plugin | Typical ingress controller | IP address management | Service communication | Ingress |
|---|---|---|---|---|---|
|
AWS |
Assign IPs from AWS VPC subnets |
Use AWS VPC routing |
Deploy AWS Load Balancers |
||
|
GCP |
Assign IP addresses from Cloud VPC subnets |
Use Cloud VPC routing |
Deploy Cloud Load Balancers |
||
|
Azure |
Assign IP addresses from VNet subnets |
Use VNet routing |
Deploy Nginx |
Now that you’ve seen the two most common types of virtual networks, let’s go through an example of deploying one in AWS.
Example: Create a VPC in AWS
In this section, you’re going to create a custom VPC in AWS, and deploy
some EC2 instances into it. In this blog post series’s
sample code repo, in the
ch7/tofu/modules/vpc folder, you’ll find a
vpc module that can create the VPC shown in
Figure 63:
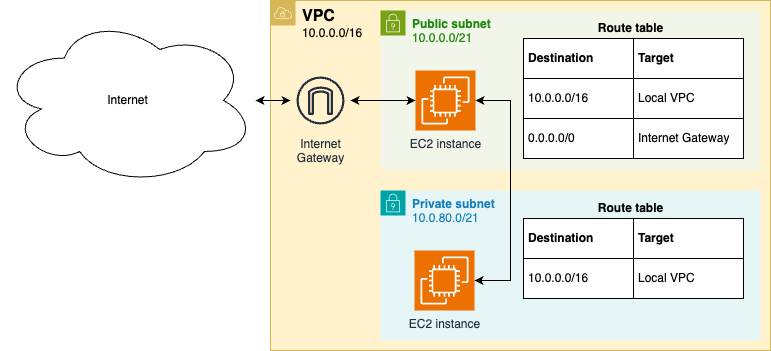
This VPC will have the following configuration:
- IP address range
-
The VPC allows you to specify the IP address range (CIDR block) to use. For example, as shown in the preceding diagram, you could use
10.0.0.0/16, which is one of the private IP address ranges from RFC 1918, and/16is the largest CIDR block AWS allows, which gives you 65,536 IP addresses, enough for most use cases. Thevpcmodule automatically splits this IP address range amongst two subnets, a public subnet and a private subnet, as described next. - Public subnet
-
The VPC includes a public subnet, which is a subnet that is directly accessible from the public Internet (a DMZ). You typically use public subnets to run servers meant to be accessed by your users directly, such as load balancers. In AWS, to make a subnet public, you have to do three things (all of which the
vpcmodule handles for you). First, you create an Internet Gateway, which is an AWS-specific component that allows communication between the public Internet and your VPC. Second, you create a route in the subnet’s route table to send traffic to the Internet Gateway, which you typically handle via a catch-all route (0.0.0.0/0) that assumes any traffic that doesn’t match a more specific destination must be targeted for the public Internet. Third, you configure the VPC to assign public IP addresses to any EC2 instances you deploy into it. The public subnet also assigns private IP addresses to EC2 instances from a part of the VPC’s IP address range (e.g.,10.0.0.0/21). - Private subnet
-
The VPC also includes a private subnet, which is a subnet that is not directly accessible from the public Internet. You typically use private subnets to run the rest of your servers, and especially data stores, in a more protected environment. In AWS, subnets are private by default, which means servers in those subnets will be able to talk to other resources within the VPC, but nothing outside the VPC will be able to talk to those servers, and, unless you add a NAT gateway (which this
vpcmodule does not do), those servers won’t be able to talk to anything outside the VPC (such as the public Internet). This makes it harder both for malicious actors to get into your servers, and if they somehow do get in, it also makes it harder for them to get any data out. It also ensures you can’t accidentally (or maliciously) install software from the public Internet (which you won’t need if you’re using server templating and immutable infrastructure practices, as introduced in Part 2).
To use the vpc module, create a new OpenTofu root module called
vpc-ec2:
$ cd fundamentals-of-devops

$ mkdir -p ch7/tofu/live/vpc-ec2

$ cd ch7/tofu/live/vpc-ec2
Inside the vpc-ec2 folder, create main.tf with the contents shown in Example 127:
vpc module (ch7/tofu/live/vpc-ec2/main.tf)
provider "aws" {

  region = "us-east-2"

}


module "vpc" {

  source  = "brikis98/devops/book//modules/vpc"

  version = "1.0.0"


  name       = "example-vpc"   (1)

  cidr_block = "10.0.0.0/16"   (2)

}
The preceding code uses the vpc module to do the following:
| 1 | Set the name of the VPC to "example-vpc." |
| 2 | Configure the VPC to use 10.0.0.0/16 as its CIDR block. |
By itself, a VPC doesn’t do much, so let’s deploy some EC2 instances into it. First, update main.tf to deploy an EC2 instance in the public subnet, as shown in Example 128:
module "public_instance" {

  source  = "brikis98/devops/book//modules/ec2-instances"

  version = "1.0.0"


  name          = "public-instance"                   (1)

  num_instances = 1                                   (2)

  instance_type = "t2.micro"

  ami_name      = "sample-app-packer-*"               (3)

  http_port     = 8080

  user_data     = file("${path.module}/user-data.sh") (4)

  vpc_id        = module.vpc.vpc.id                   (5)

  subnet_id     = module.vpc.public_subnet.id         (6)

}
The preceding code uses the ec2-instances module you saw earlier in
this blog post to deploy an EC2 instance as follows:
| 1 | Name the instance "public-instance." |
| 2 | Deploy just a single EC2 instance. |
| 3 | Once again, run the "sample-app-packer" AMI you built in Part 3. |
| 4 | Configure the instance to run a user data script you’ll see shortly. |
| 5 | Configure the instance to run in the VPC you created. |
| 6 | Configure the instance to run in the public subnet of the VPC you created. |
Copy the user data script from Part 3:
$ cp ../../../../ch3/tofu/live/asg-sample/user-data.sh .Now that you have an instance in the public subnet, update main.tf to deploy an instance in the private subnet as shown in Example 129:
module "private_instance" {

  source  = "brikis98/devops/book//modules/ec2-instances"

  version = "1.0.0"


  name          = "private-instance"                   (1)

  num_instances = 1

  instance_type = "t2.micro"

  ami_name      = "sample-app-packer-*"

  http_port     = 8080

  user_data     = file("${path.module}/user-data.sh")

  vpc_id        = module.vpc.vpc.id

  subnet_id     = module.vpc.private_subnet.id         (2)

}
This code is identical to the code for the public instance, except for the following:
| 1 | Name the instance "private-instance." |
| 2 | Run the instance in the private subnet of the VPC you created. |
Create a file called outputs.tf with the contents in Example 130:
output "public_instance_public_ip" {

  description = "The public IP of the public instance"

  value       = module.public_instance.public_ips[0]

}


output "public_instance_private_ip" {

  description = "The private IP of the public instance"

  value       = module.public_instance.private_ips[0]

}


output "private_instance_public_ip" {

  description = "The public IP of the private instance"

  value       = module.private_instance.public_ips[0]

}


output "private_instance_private_ip" {

  description = "The private IP of the private instance"

  value       = module.private_instance.private_ips[0]

}
This code outputs the public and private IP addresses for the EC2 instances.
Deploy the vpc-ec2 module as usual, authenticating to AWS, and
running init and apply:
$ tofu init

$ tofu apply
When apply completes, you should see some outputs:
private_instance_private_ip = "10.0.80.65"

private_instance_public_ip = ""

public_instance_private_ip = "10.0.5.100"

public_instance_public_ip = "3.144.105.254"
The outputs include the private IP addresses for both instances, which should
fall into the 10.0.0.0/16 CIDR block of the VPC, as well as the
public IP of the public instance, but not the public IP of the private
instance (it’ll be an empty string). This is not a bug; since you deployed
the private instance into a private subnet, that instance shouldn’t have a
public IP address!
To see if the instances are working, make an HTTP request to the public IP and port 8080 of the public instance:
$ curl http://3.144.105.254:8080

Hello, World!
You should see the familiar "Hello, World!" response. If that works, congrats, you now have an instance successfully running in a custom VPC!
|
Get your hands dirty
Here are a few exercises you can try at home to go deeper:
|
You’ve been able to confirm that the public instance is working, but how do you test the private instance? It has no public IP, and if you try to make a request to the private IP from your own computer, that won’t work:
$ curl http://10.0.80.65:8080

curl: (7) Failed to connect to 10.0.80.65 port 80 after 19 ms
To be able to test the instance in the private subnet, you’re going to have to learn how to access private networks, which is the focus of the next section.
Accessing Private Networks
Deploying a server in a private network ensures that you can’t access that server directly from the public Internet. This is mostly a good thing, as it makes it harder for malicious actors to get access to your servers. However, if you can’t access those servers either, then that’s a problem. As you saw in the previous section, a server in a private subnet has no public IP address. It might be running and working, but if you can’t access it, testing, debugging, and development become harder.
Fortunately, there are ways to grant secure, controlled access to your private networks. Broadly speaking, there are two primary ways to do this, the castle-and-moat model and the zero-trust model, as discussed in the next two sections.
Castle-and-Moat Model
The traditional approach used at many companies for managing access to private networks is the castle-and-moat model, based on the analogy to a castle with a secure perimeter (walls, moat, drawbridge, etc.), and a soft interior. It’s hard to get into the castle, but once you’re inside, you have you free rein to move around. The equivalent with a private network is one that doesn’t allow you to access anything from outside the network, but once you’re "in" the network, you can access everything.
In a physical network, with the castle-and-moat model, merely being connected to the network means you’re "in." For example, with many corporate office networks, if you are plugged into the network via a physical cable, you can access everything in that network: all the wiki pages, the issue tracker, the IT help desk, and so on. However, if you’re outside the physical network, how do you connect to it? For example, if you’re working from home, how do you get access to your corporate office network? Or if you have infrastructure deployed in a VPC in the cloud, how do you get access to the private subnets of that VPC?
A common solution is to deploy a bastion host. In a fortress, a bastion is a structure that is designed to stick out of the wall, allowing for more reinforcement and extra armaments, so that it can better withstand attacks. In a network, a bastion host is a server that is designed to be visible outside the network (i.e., it’s in the DMZ), and this server has extra hardening and monitoring, so it can better withstand attacks. The idea is that you keep the vast majority of your servers private, with the network acting as a secure perimeter (like a wall and moat), and you use the bastion host as the sole entrypoint to that network. Since there’s just one bastion, you can put a lot of effort into making it secure. Users to connect to the bastion host using protocols such as SSH, RDP, or VPN, as you’ll see later in this blog post. Since the bastion host is "in" the network, once you’ve successfully connected to the bastion host, you’re now also "in," and you can access everything else in the network, as shown in Figure 64:
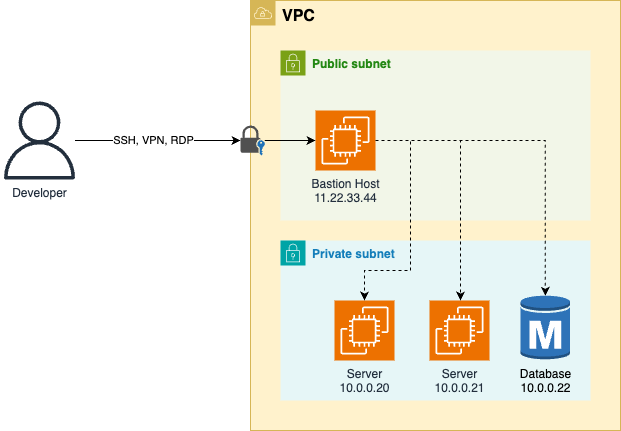
For example, if you are able to connect to the bastion host in
Figure 64, you can access everything in the
private subnets of that VPC, including the private servers and database with IPs
10.0.0.20, 10.0.0.21, and
10.0.0.22. This approach worked in the past, but in the modern world,
the castle-and-moat approach leads to security concerns, as discussed in the next
section.
Zero-Trust Model
The castle-and-moat approach originated in a world where:
-
You had a physical network (routers, switches, cables) in an office.
-
You had to physically be in the office to access the network.
-
You had to use a company computer to connect to the network.
In short, your location on the network mattered: some locations could be trusted, while others could not. This is increasingly not the world we live in, as these days:
-
Many of the networks are virtual, such as VPCs in an AWS account.
-
Many employees work remotely, accessing the network from homes, coworking spaces, coffee shops, airports, and so on.
-
Many personal devices (laptops, tablets, phones) need to connect to the network.
As a result, for many companies, the idea of a secure perimeter and soft interior no longer makes sense. There’s no clear "perimeter" or "interior" anymore, and there’s no location on the network that can be implicitly trusted. This has led to the rise of zero-trust architecture (ZTA), which is based on the concept of "never trust, always verify," where you never trust a user or device just because they have access to some location on the network. The core principles of ZTA can be summarized as follows:
- Authenticate every user
-
Every connection requires the user to authenticate, typically using single sign-on (SSO) and multi-factor authentication (MFA).
- Authenticate every device
-
You can connect from any device (laptop, tablet, phone), as long as you’ve gone through the company’s processes to install security controls (e.g., security scanners), and gotten the device approved and added to a device inventory.
- Encrypt every connection
-
All network communication must be over encrypted channels. You’ll learn more about encryption in Part 8.
- Define policies for authentication and authorization
-
Each piece of software in the network can define policies for who is allowed to access that software and what permissions they will have. These policies can make use of a variety of data sources, such as the user’s location (e.g., their home office or a different continent), the time of day (e.g., during normal work hours or the middle of the night), how often they are connecting (e.g., first time today or 5,000 times in the last 30 seconds), and so on.
- Enforce least-privilege access controls
-
With the castle-and-moat model, once you’re in the network, you get access to everything: e.g., once you connect to a bastion host, you get access to all the wiki pages, the issue tracker, the IT help desk, and so on. With the ZTA model, you follow the principle of least privilege, which means you get access only to the resources you absolutely need to do your specific task, and nothing else: e.g., getting access to the internal wiki only gives you access to the wiki, and does not give you access to issue tracker, the IT help desk, or anything else.
- Continuously monitor and validate
-
The assumption with ZTA is that you’re constantly under attack, so you need to continuously log and audit all traffic to identify suspicious behavior.
Some of the major publications on the zero trust model include No More Chewy Centers: Introducing The Zero Trust Model Of Information Security by John Kindervag, where he coins the term "Zero Trust Model," Zero Trust Architecture by NIST, and BeyondCorp: A New Approach to Enterprise Security by Google. Google’s BeyondCorp paper is arguably what popularized the zero trust model, even though the paper doesn’t ever use that term.
A surprising principle in the BeyondCorp paper is that Google no longer requires employees working remotely to use VPN to access internal resources. Instead, those resources are accessible directly via the public Internet. This may seem like a paradox: how can exposing internal resources to the public be more secure? Google’s take is that exposing internal tools publicly forces you to put more effort into securing them than if you merely relied on the network perimeter for security. Figure 65 shows a simplified version of the architecture Google described in BeyondCorp:
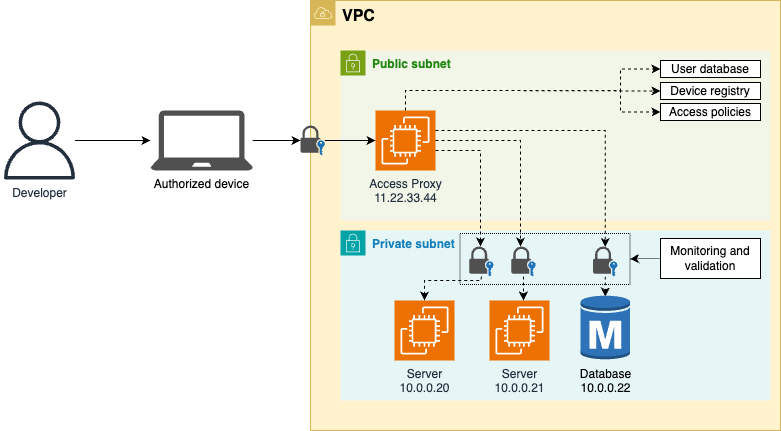
The idea is that you expose your internal resources to the public Internet via an access proxy, which uses the user database, device registry, and access policies to authenticate, authorize, and encrypt every connection. From a quick glance, the zero-trust approach in Figure 65 might not look all that different from the castle-and-moat approach in Figure 64: both rely on a single entrypoint to the network (a bastion host or an access proxy) that grants access to private resources. The key difference is that in the castle-and-moat approach, only the bastion host is protected, and all the private resources are open, so if you can get past the bastion, you get access to all the private resources, whereas with the zero-trust approach, every single private resource is protected, and each one requires you to go through an authorization process with the access proxy. Instead of a single perimeter around all the resources in your network, the zero-trust approach is like putting a separate perimeter around each individual resource.
That means that zero-trust isn’t a single tool you adopt, but something you integrate into every part of your architecture, including the following:
- User and device management
-
One of the first steps with using ZTA is to get better control over users and devices. You typically want to ensure that authentication for all the software you rely on—e.g., your email, version control system, bug tracker, cloud accounts, and so on—is done through a single identity provider (SSO) that requires MFA. Some tools that can help in this space include JumpCloud, Okta, and OneLogin (full list). You’ll also want to figure out what sorts of devices you want to allow employees to use and how to track, secure, and authenticate those with a device registry. This is the domain of Mobile Device Management (MDM), and some of the major players in this space include JumpCloud, Rippling, and Microsoft Intune (full list).
- Infrastructure access
-
One tricky problem is how to manage access to infrastructure tools that vary widely in terms of the protocols, authentication, and encryption they support: e.g., servers (e.g., SSH), databases (e.g., PostgreSQL client), containers (e.g., running in Kubernetes), networks (e.g., a VPC in AWS), and so on. Tools such as Teleport and Tailscale (full list) can help.
- Service communication
-
Finally, you’ll have to rework how your microservices communicate with each other. In Part 6, you deployed a frontend and backend microservice in Kubernetes, and the frontend was able to talk to the backend with no authentication, authorization, or encryption. This is how many microservice architectures are designed, relying on the network perimeter to protect those services (the castle-and-moat model). In the ZTA world, you’ll need a more secure approach, as you’ll see this later in this blog post.
Implementing a true zero-trust architecture is a tremendous amount of work, and few companies pull it off fully. It’s a good goal for all companies to strive for, but how far down the ZTA path you go depends on your scale of company. Smaller startups will typically use the castle-and-moat approach; mid-sized companies will often adopt a handful of ZTA principles, such as using SSO and securing microservice communication; large enterprises will try to go for most of the ZTA principles. As you saw in Section 1.4, you need to adapt your architecture to the needs and capabilities of your company.
|
Key takeaway #5
In the castle-and-moat model, you create a strong network perimeter to protect all the resources in your private network; in the zero-trust model, you create a strong perimeter around each individual resource. |
Now that you’ve seen the castle-and-moat and zero-trust models, let’s look at some of the most common tools you use to access private networks: SSH, RDP, and VPN. The following sections will go through each of these options, starting with SSH.
SSH
Secure Shell (SSH) is a client-server protocol that allows you to connect to a computer over the network to execute commands, as shown in Figure 66.
For example, the client could be the computer of a developer on your team named Alice and the server could be the bastion host. When Alice connects to the bastion host over SSH, she gets a remote terminal where she can run commands and access the private network as if she was using the bastion host directly.
SSH is ubiquitous: just about all modern Linux, Unix, and macOS distributions support SSH natively, and there are multiple clients for Windows. SSH is also generally considered a mature and secure protocol, as it’s an open standard with open source implementations, it has been around for around 30 years, and due to its ubiquity, it has a massive community around it.
Under the hood, SSH uses public-key cryptography for authentication and encryption; you’ll learn more about these topics in Part 8. For now, all you need to know is that SSH relies on a key pair, which consists of a public key and a private key. Configuring one server to accept one user’s public key is no problem, but at scale, this becomes a challenge. If you need to support a large number of servers and developers, key rotation and revocation (e.g., when a developer leaves the company), and different levels of permissions and access (including temporary access), things get a lot more complicated. One solution is to use managed services from cloud providers, such as EC2 instance connect in AWS or metadata-managed SSH connections in Google Cloud (full list). Another solution is to use the general-purpose connectivity tools I mentioned earlier: e.g., Teleport, TailScale, etc.
Let’s take a quick look at how to use SSH.
How to use SSH
To use SSH, you first configure the client (e.g., Alice’s computer), as follows:
-
Create a public and private key pair for Alice.
-
Store the private key securely on Alice’s computer, so only she can access it.
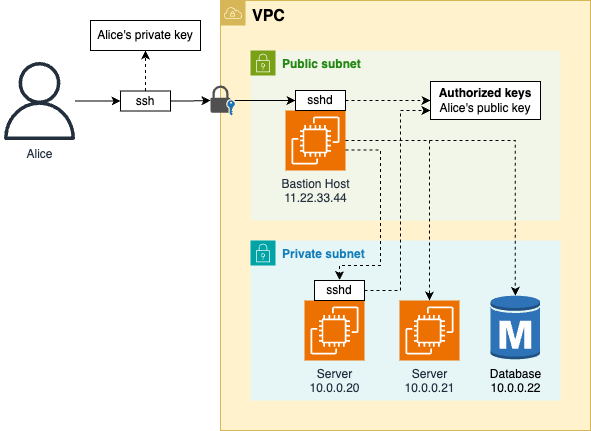
Next, you configure one or more servers, such as the bastion host and the servers in the private subnets of Figure 66, as follows:
-
Run SSH as a background process, known as a daemon. You typically do this using the
sshdbinary. On many servers, it’s enabled by default. -
Update the server’s firewall to allow SSH connections, typically on port 22.
-
Configure who is allowed to authenticate to a server by adding their public key to the authorized keys file for an OS user on that server, typically in ~/.ssh/authorized_keys. For example, if you wanted to allow Alice to SSH to the server as the OS user
ec2-user, with home folder/home/ec2-user, you’d need to add Alice’s public key to/home/ec2-user/.ssh/authorized_keys.
Now that you’ve configured your clients and servers, you can use the SSH
client to connect to the server, and get a terminal where you can run commands
as if you were sitting directly at that server. You also get access to that
server’s network: e.g., if Alice connects to the bastion host in
Figure 66, she could run the
curl command in the terminal to access the server in the private
subnet at 10.0.0.20.
Let’s try SSH out with a real example in AWS.
Example: SSH bastion host in AWS
Earlier in this blog post, you deployed a VPC and two EC2 instances, one in a public subnet you could access, and one in a private subnet that you could not. Let’s update that example so that you can access both instances over SSH. We’ll use an EC2 key pair to do this, which is a key pair that AWS can create and manage.
|
Watch out for snakes: EC2 key pairs are not recommended in production
This example uses EC2 key pairs so you can try an idiomatic SSH
experience where you use the |
Head to the EC2 key pair page, and click "Create key pair." Enter a name for the key pair, leave all other settings at their defaults, and click "Create key pair." AWS will store the public key for the key pair in its own database, but it will not store the private key. Instead, it’ll prompt you to download the private key to your computer. Make sure to save it in a secure location, such as your ~/.ssh folder.
Next, add a passphrase to the private key, so only you can access it:
$ ssh-keygen -p -f <KEYPAIR>.pem

Enter new passphrase (empty for no passphrase):

Enter same passphrase again:
Finally, set the permissions for the private key so that only your OS user can
access it (ssh won’t let you use the private key otherwise):
$ chmod 400 <KEYPAIR>.pem
You now have the private key securely stored on your hard drive. The only thing
left is to add your public key to the authorized keys file on each of those EC2
instances. AWS will do this for you automatically if you specify a key pair when
launching an EC2 instance. For example, if you specify a key pair when launching
an Amazon Linux AMI, AWS will add the public key to the authorized keys file of
the OS user ec2-user. Update main.tf in the
vpc-ec2 root module to specify the name of your key pair as shown
in Example 131:
module "public_instance" {

  key_name = "<YOUR_KEYPAIR_NAME>" # TODO: fill in your EC2 key pair name


  # ... (other params omitted) ...

}


module "private_instance" {

  key_name = "<YOUR_KEYPAIR_NAME>" # TODO: fill in your EC2 key pair name


  # ... (other params omitted) ...

}
Make sure to update the key_name parameter for both the public and
private instance to whatever you named your key pair. Once you specify a
key_name, the ec2-instances module automatically opens
up port 22 in the security group so that you can access that instance via SSH.
To deploy these changes, run apply:
$ tofu apply
You should see in the plan output that OpenTofu wants to deploy two new
instances. This is expected, as AWS can only update the authorized keys file on
the first boot, so it will need to replace the instances. When
apply
completes, you should have new EC2 instances, with new IP addresses:
private_instance_private_ip = "10.0.80.242"

private_instance_public_ip = ""

public_instance_private_ip = "10.0.1.26"

public_instance_public_ip = "18.226.187.40"
Grab the public IP address of the public instance from the
public_instance_public_ip output variable and try to SSH to the
server as follows:
$ ssh -i <KEYPAIR>.pem ec2-user@<PUBLIC_IP>

The authenticity of host '<PUBLIC_IP>' can't be established.

ED25519 key fingerprint is SHA256:v+MXP6xY/O3lGxlyywpBhEmr+qFwS0H2ASy77XPodNY.

Are you sure you want to continue connecting (yes/no/[fingerprint])?
You’ll see the "authenticity of host can’t be established" warning the first time you SSH to any new server, as your SSH client can’t be sure that this is really the server you wanted to talk to, and not a malicious actor who has intercepted your request. If you want to be diligent, go to the EC2 console, click on the checkbox next to the instance you’re trying to connect to, and in the nav on top, choose Actions > Monitor and troubleshoot > Get system log, and you’ll see log output similar to Figure 67:
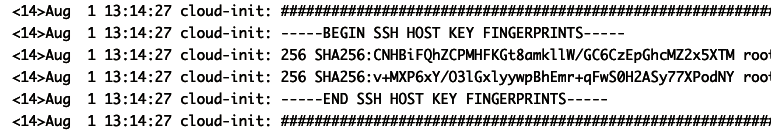
The system log can be useful for debugging your EC2 instances directly from the
web browser. Near the bottom of the system log file, you should see the text
"BEGIN SSH HOST KEY FINGERPRINTS," and below that, the fingerprint you see there
should match the one in the ssh warning message. If it does, type
in yes on your terminal, and hit Enter.
ssh will store this fingerprint in your
~/.ssh/known_hosts file, and not prompt you about it for this IP
address in the future (unless the fingerprint changes, in which case,
you’ll get an error, as that suggests malicious activity).
After the fingerprint check, ssh will prompt you to enter the
password for your SSH key. Type it in and hit Enter. After a second or two more,
you should be connected to the server via SSH, and you’ll get a terminal
prompt on the EC2 instance:
Amazon Linux 2023

https://aws.amazon.com/linux/amazon-linux-2023

[ec2-user@ip-10-0-1-26 ~]$
At this point, you can run commands on this EC2 instance. For example, you can check if the simple web app is working locally:
$ curl localhost:8080

Hello, World!
More interestingly, since you are now "in" the network, you can finally test if
the web app is working on the private instance! Grab the private instance IP
address from the private_instance_private_ip output variable and
try it out:
$ curl <PRIVATE_IP>:8080

Hello, World!
Congrats, you’re finally able to access an instance in a private network! In fact, you’re effectively using the public instance as a bastion host. Is it possible to SSH to the private instance, too? This would imply using the bastion host as a jump host, which you use as a hop on your way to other servers in the private network. Let’s give it a shot.
Hit CTRL+D to disconnect from the public instance, and you’ll end up back
in a terminal on your own computer. If you use SSH frequently, having to specify
a private key and enter the password each time can become tedious, so it’s
common to use SSH agent, which is a key manager for SSH that
temporarily stores your private key in memory, unencrypted, so you can
authenticate without specifying a key or password. Use ssh-add to
add a key to SSH agent:
$ ssh-add <KEYPAIR>.pem
Enter your password one more time and hit Enter. Now, re-run the SSH command for
your public instance, but this time, omit the -i parameter, as your
private key is already loaded in SSH agent, and add the
-A parameter to enable agent forwarding, which will allow
you to use SSH agent to authenticate from an intermediary server like the
bastion host without having to copy or expose your private key:
$ ssh -A ec2-user@<PUBLIC_IP>After a few seconds, you should end up in a terminal on the EC2 instance, but this time, with no prompt about the host key or your SSH password. Next, run SSH again, but this time, point at the IP address of the private instance:
$ ssh ec2-user@<PRIVATE_IP>
This time, you’ll see the host key warning again, as you haven’t
connected to the private instance before. Type in
yes and hit Enter. After a second or two, you
should get a terminal on the private instance, without any further prompts, as
authentication should happen through SSH agent forwarding. You can now run
commands on the private instance, such as checking if the web app is working
locally:
$ curl localhost:8080

Hello, World!
Congrats, you used a public instance as a jump host to SSH to a private instance! To disconnect, hit CTRL+D twice, once for the private and once for the public instance.
|
Get your hands dirty
Here are a few exercises you can try at home to go deeper:
|
When you’re done testing, commit your code, and run
tofu destroy to clean everything up in your AWS account.
SSH is great for developers; it’s not so great for anyone else at your company. Asking the typical Product Manager, Designer, or Sales Executive to use SSH to access your company’s internal tooling is not likely to go over well. Moreover, even for developers, there are many times when you want an easy way to access a private network without having to jump through various hoops with CLI commands, tunnels, and proxies. Sometimes, you just want an easy-to-use UI. This is precisely where RDP truly shines, as discussed in the next section.
RDP
Remote Desktop Protocol (RDP) is a way to connect to a Windows server remotely and to manage it via the full Windows user interface, as shown in Figure 68. It’s just like being at the computer: you can use the mouse, keyboard, and all the desktop apps.
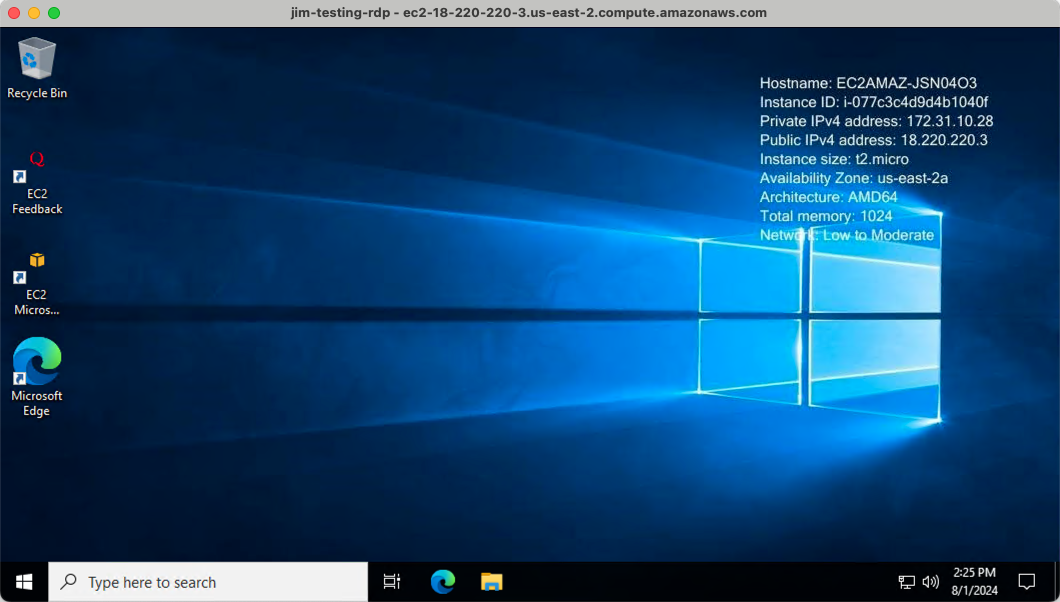
Being able to use the full Windows UI makes RDP accessible to all roles at a company (not just developers), and it can be a nicer experience than being limited to a terminal (as with SSH). However, RDP only works with Windows servers, and it is somewhat notorious for security vulnerabilities, so you can’t expose it directly to the public Internet (as you’ll see shortly).
Let’s take a quick look at how to use RDP.
How to use RDP
Like SSH, RDP uses a client-server architecture. First, you configure the server:
-
Enable RDP in Windows settings.
-
Update the server’s firewall to allow RDP connections, typically on port 3389. Note that RDP is not generally considered secure—it has had many security vulnerabilities over the years—so exposing port 3389 directly to the public Internet is not recommended. Instead, that port should only be exposed within your network to one of the two devices in the next step.
-
Deploy either a VPN (you’ll learn more about this in the next section) or a Remote Desktop Gateway (RD Gateway) in front of the server(s) you have running RDP to protect them from direct access, and provide more secure authentication and encryption.
Next, you configure the client:
-
Install the RDP client. It’s available out-of-the-box with most Windows installs, but if you’re on Mac or Linux, you’ll have to install it separately.
-
Get credentials to authenticate to the Windows server. How you do this depends on the server. For example, if you launch a Windows EC2 instance in AWS using the default Windows AMI, AWS has an Administrator user built-in with a randomly-generated password that you can retrieve from the EC2 console; if you launch a Windows server in Azure, you specify the user and password at launch time; if you manage Windows user accounts with an identity provider (e.g., Active Directory, Microsoft 365), then you’d use that identity provider’s login.
Now that you’ve configured your clients and servers, you open up the RDP client, type in the IP address of the server to connect to (which might be an RD Gateway IP), enter the username and password when prompted, and after a minute or two, you’ll be logged in. This will give you access to the full Windows UI, as you saw in Figure 68, and from that UI, you’ll have access to the private network.
Being able to use a UI to access the private network is great, but it’s the UI of another computer. Sometimes, you want to be able to access the private network directly from your own computer’s UI, as that’s where you have all your apps and data. This is one of the areas where VPN shines, as discussed in the next section.
VPN
A Virtual Private Network (VPN) is a way to extend a private network across multiple networks or devices. The fact that you’re on VPN is transparent to the software running on those devices. That is, that software can communicate with the private network as if the device was plugged physically into the network, without the software being aware of the VPN or having to do anything differently.
There are VPN clients for almost every operating system (including smartphones), allowing you to access private networks from your own devices in a way that’s accessible to all roles at a company (and not just developers). Most VPN tools are built around either IPsec (Internet Protocol Security) or TLS (Transport Layer Security), two protocols that are generally considered mature and secure, as they have been around for more than 30 years, are ubiquitous, and have massive communities around them.
Note that IPsec and TLS typically rely on certificates, which are based on public-key cryptography (like SSH), but allow for mutual authentication, where the client can verify the VPN server is really who it says it is using the server’s certificate, and the server can verify the user is really who they say they are using the client’s certificate. This is great for security, but managing certificates at scale can sometimes be challenging (you’ll learn more about IPsec, TLS, and certificates in Part 8). Another challenge with VPN is that routing all your network traffic through VPN servers can increase latency and degrade throughput.
These days, there are three common use cases for VPNs:
- Connect remote employees to an office or data center network
-
If you’re working from home, you connect to a VPN, and you get access to your corporate office network as if you were in the office. Similarly, you can use a VPN to connect to a data center, whether on-prem or a VPC in your cloud account, and you get access to everything in that private network as if your computer was in the same data center. In this use case, the VPN acts as a bastion host. Some of the major players that address this use case include Cisco, Palo Alto Networks, and Juniper Networks (full list).
- Connect two data centers together
-
You can use site-to-site VPN to connect two data centers together: e.g., connect two on-prem data centers or connect your on-prem data center to a VPC in the cloud. In this use case, the VPN acts as a proxy between the data centers, securely forwarding certain traffic in one private network to certain endpoints in another private network. The VPN vendors you’d use on the on-prem side are largely the same ones as for an office network (e.g., Cisco, Palo Alto, Juniper); on the cloud side, you typically use site-to-site VPN services from the cloud provider, such as AWS Virtual Private Gateways and Google Cloud VPN.
- Hide Internet browsing behavior
-
You can proxy your Internet traffic through a VPN in another country as a way to bypass geographical restrictions or censorship, or to keep your browsing history anonymous. Most of the office network VPNs are overkill for this use case, so it’s more common to use consumer VPN services such as NordVPN, ExpressVPN, and Proton VPN. I mention this use case for completeness, but it’s outside the scope of this blog post series, so I won’t say much more on it.
Let’s take a quick look at how to use VPN for the first two use cases.
How to use VPN
For the use case of connecting remote employees to an office or data center network, you typically use a client-server architecture. First, you configure the VPN server:
-
Deploy a VPN server as your bastion host and configure the VPN software on it.
-
Update the server’s firewall to allow VPN connections. The ports you use for this depend on the VPN tool. For example, IPsec typically uses several ports (500, 4500, 50, 51) while TLS typically uses port 443.
-
Configure the VPN server with the ability to authenticate users. How this works also depends on the VPN tool. For example, OpenVPN allows users to authenticate with a certificate, whereas Tailscale allows users to authenticate using an existing identity provider, such as Active Directory, Google, or Okta (under the hood, Tailscale also uses certificates, but it manages them automatically).
Next, you configure the client:
-
Install the VPN client. The exact client you use depends on the VPN tool.
-
Use the VPN client to authenticate to the server.
-
Once you’re authenticated, the VPN client will establish an encrypted tunnel to the VPN server and update the network settings on your device to route all network traffic through this tunnel. This is known as a full tunnel configuration. As a result, all the software on your device—your web browser, your email client, all your apps—will transparently get access to the private network, as if your device was physically plugged into that network. Note that a full tunnel configuration has some drawbacks. For example, if employees are watching lots of videos on Netflix or YouTube, all of that network traffic now goes through the VPN, which may put a lot of load on your VPN and cost a lot of money for bandwidth. As a result, some VPN software allows you to use split tunnel mode where only certain traffic is routed via the VPN. For example, you could configure specific domain names and CIDR block ranges that correspond to internal tooling to go via the VPN tunnel, and everything else to go via the user’s normal Internet connection.
For the use case of connecting two data centers together, the details depend on what devices you’re using, but at a high level, in each data center, you do the following:
-
Set up a site-to-site VPN device. On-prem, that might be a physical appliance from Cisco, Palo Alto Networks, Juniper, etc. In the cloud, that might be a virtual configuration, such as a Virtual Private Gateway (VPG) in AWS.
-
Configure routing. Typically, you will want to route certain CIDR blocks through the VPN connection to the other data center. For example, if your on-prem data center uses the CIDR block
172.16.0.0/12, you might configure the route table in your AWS VPC to send all traffic to172.16.0.0/12to your VPG. -
Configure connectivity and authentication. For the VPN in each data center, you’ll need the IP addresses it uses, various identifying information, such as a Border Gateway Protocol (BGP) Autonomous System Number (ASN), and a way to authenticate and encrypt the connection, typically via certificates or pre-shared secret keys.
-
Create the VPN tunnel. At this point, you establish an encrypted tunnel, and all traffic that is routed to your VPN is exchanged over this tunnel.
Now that you’ve seen how to access a private network from the outside, let’s turn our attention to how services within a private network can communicate.
Service Communication in Private Networks
In Part 6, you saw that a common way to deal with problems of scale, such as more traffic and more employees, is to break the codebase up into multiple services that are deployed independently and communicate with each other by sending messages over the network. In order to support service communication, there are three technical decisions you’ll have to make:
- Service discovery
-
How does one service figure out the endpoint(s) to use for another service?
- Service communication protocol
-
What is the format of the messages that services send to each other?
- Service mesh
-
How do you handle security, resiliency, observability, and traffic management?
Everyone who deploys services has to deal with the first two decisions, service discovery and communication protocol, right away. The third decision, service mesh, is typically only necessary at larger scales. The following sections will go through each of these problems and discuss some of the tools and approaches you can use to solve them, starting with service discovery.
Service Discovery
As soon as you have one service, A, that needs to talk to another service, B, you have to figure out service discovery: how does A figure out the right IP addresses to use to talk to B? This can be a challenging problem, as each service may have multiple replicas running on multiple servers, and the number of replicas and which servers they are running on may change frequently as you deploy new versions, replicas crash and are replaced, or you scale the number of replicas up or down in response to load.
|
Key takeaway #6
As soon as you have more than one service, you will need to figure out a service discovery solution. |
The next section will go over some of the tools you can use for service discovery.
Service discovery tools
One approach to service discovery is to repurpose one of the following generic tools:
- Configuration files
-
The simplest solution is to hard-code server IP addresses in configuration files, using any of the application configuration tools you saw in Part 6, such as JSON, YAML, Cue, or Dhall. For example, service A might have a config file with the hard-coded IP addresses of the servers where B is deployed. This works as long as the IP addresses used by B don’t change too often, such as an on-prem data center, where you have a relatively fixed set of physical servers for B.
- Load balancers
-
Instead of hard-coding the IP addresses of every server, you could deploy an internal load balancer (a load balancer only accessible within your private network) in front of your services using any of the load balancers you saw in Part 3, such as AWS ELB, GCP Cloud Load Balancer, or Nginx, and hard-code just the endpoints for the load balancer in each environment. Each service can then look up the load balancer endpoint in its configuration and make requests to other services using a convention: e.g., service A will know it can reach service B at the
/Bpath of the load balancer. - DNS
-
If you squint at it, you might realize that service discovery is about translating a name (the name of a service) to a set of IP addresses. As it turns out, we have a system for doing just that: DNS! It’s common to have private DNS servers in a data center, and most cloud providers offer private DNS services such as Private hosted zones in AWS, Private zones in Google Cloud, and Private DNS in Azure, so you can create a DNS record that points to the IP addresses for each service, and use a convention for service discovery: e.g., service A would know that it can talk to service B at the domain
B.internal.
A second approach is to use tools purpose-built for service discovery, most of which fall into the following two buckets:
- Library
-
Tools such as Consul (if you use the Consul client directly) and Eureka (full list), come with two key ingredients: a service registry and a service discovery library. The service registry is a data store that stores the endpoint data for your services, performs health checks to detect when endpoints are up and down, and, most importantly, allows you to subscribe to updates, so you are notified immediately whenever endpoints are updated. You then incorporate a service discovery library into your application code to (a) add your service’s endpoints to the registry when your service is booting, and (b) subscribe to the registry for endpoint data on all other services, which you cache in memory. To make a service call, you look up the service endpoint data in memory, and send a request directly to one of those endpoints.
- Local proxy
-
Tools such as Consul (if you use Consul DNS or Consul Template), gRPC with etcd, and Envoy, as well as the service discovery mechanisms built into orchestration tools such as Kubernetes (full list), also come with two key ingredients: a service registry and a local proxy. You run the local proxy on the same servers as your apps, either by deploying it as a sidecar container (a container that is always deployed in tandem with your application containers), or by running it as a daemon (a background process on each server in your cluster), and it does exactly the same thing as the service discovery library: it adds your service’s endpoints to the registry when your service is booting, and it subscribes to and caches endpoint data from the registry. The difference is that the local proxy does not require you to make any changes to your application code. Instead, the proxy overrides the network settings in each container or server to either send all traffic through this proxy, or to use the proxy as a local DNS server, and the proxy will then use its cached endpoint data to transparently route your app’s requests to the proper endpoints.
Now that you’ve seen the various options for service discovery tools, how do you pick the right one? That is the focus of the next section.
Service discovery tool comparison
Here are some of the key trade-offs to consider when picking a service discovery tool:
- Manual error
-
Any solution that involves hard-coding data is error-prone. Every place I’ve worked that hard-coded IP addresses, either of servers or load balancers, had frequent bugs and outages due to errors in the configuration files.
- Update speed
-
One of the biggest advantages of the dedicated service discovery tools is that you can subscribe to updates from the service registry, so you get the latest endpoint data quickly (usually in under a second). On the other hand, hard-coded IPs only update when you update them by hand, which is slow (hours or days between updates). DNS falls somewhere in between, depending on caching settings: a low TTL means you get updates faster, but at the cost of more latency.
- Scalability
-
If you hard code IPs in configuration files, you almost always hit scaling bottlenecks once you have more than a handful of services. Load balancers can also be tough to scale, as one request from the outside world can result in dozens of internal service calls going through the load balancer, which can become a bottleneck when you have a lot of traffic.
- Transparency
-
Some service discovery solutions require you to incorporate service discovery logic into your app code, such as having to use a service discovery library. Other solutions are transparent, not requiring any updates to your app code, such as using a local proxy. To be fair, service discovery can never be completely transparent, as the app code still has to use some mechanism to make a service call, but the idea with transparent solutions is that the app does not need to be aware of your specific service discovery tool, and can instead rely on generic, portable approaches, such as using domain names.
- Latency
-
Server-side service discovery tools, such as load balancers, require every service call to go through extra network hops, which increases latency considerably (see Table 10). DNS also adds an extra network hop to query the DNS server. If you cache the DNS response, you can avoid that hop for most requests, but this comes at the cost of reducing update speed. With client-side service discovery tools, such as a service discovery library, you have all the endpoint data cached locally, so you can send the requests directly to those endpoints, without any extra network hops. The local proxy is an in-between solution: there is an extra hop to the proxy, but because it runs locally, the additional latency is miniscule compared to talking to another server.
- CPU and memory usage
-
The local proxy approach requires you to run extra code with every container or every server, which adds CPU and memory usage overhead.
- Extra infrastructure
-
Some service discovery tools require you to manage extra infrastructure, such as load balancers or service registries. This can add a lot of operational overhead, especially the service registries, as they are based on distributed data stores (e.g., Consul, etcd, ZooKeeper) that can be challenging to manage.
Table 16 shows a summary of how the service discovery tools from the previous section compare across these trade-offs:
| Configuration files | Load balancers | DNS | Registry + library | Local proxy | |
|---|---|---|---|---|---|
|
Minimize manual error |
|
|
|
|
|
|
Update speed |
|
|
|
|
|
|
Scalability |
|
|
|
|
|
|
Transparent to app code |
|
|
|
|
|
|
Minimize latency overhead |
|
|
|
|
|
|
Minimize CPU & memory overhead |
|
|
|
|
|
|
Minimize infrastructure overhead |
|
|
|
|
|


Now that you’ve seen all the different options for solving service discovery, let’s move on to the next challenge, the service communication protocol.
Service Communication Protocol
As you saw in Part 6, a big part of breaking your code into services is defining an API for the service, and maintaining it over the long term. One of the key decision you’ll have to make is the protocol you will use for that API, which consists of two primary decisions:
- Message encoding
-
How will you serialize data?
- Network encoding
-
How will you send that data over the network?
The next section will go over some of the most common protocols in use today, and the section after that will go over the key factors to consider when picking a protocol.
Common protocols
Here are some of the most common protocols in use today:
- REST APIs: HTTP + JSON
-
REST stands for Representation State Transfer, and it is the de facto standard for building web APIs. Going into all the details of REST APIs is beyond the scope of this blog post series, but two of the key ingredients are that the network encoding is HTTP and the message encoding provides a "uniform interface." The uniform interface part of REST has always been a bit vague: it most likely referred to something like HTML, but when building APIs, most teams these days use HTTP + JSON.
- Serialization libraries
-
There are a number of serialization libraries out there that support (a) defining a schema and (b) compiling stubs for various programming languages. These include Protocol Buffers, Cap’n Proto and FlatBuffers (full list). These are sometimes sent over HTTP, but one of the reasons to use a serialization library instead of JSON for the message encoding is that serialization libraries typically offer better performance, so it’s common to pick a network encoding that offers better performance too, such as HTTP/2 or TCP.
- RPC libraries
-
One level up from serialization libraries are libraries designed for remote procedure calls (RPC), which is a way for a procedure on one computer to execute a procedure on another computer (e.g., one service sending a request to another service), often with code that looks just like the code for executing a procedure locally. Some of the popular tools in this space include gRPC and Connect RPC (full list). Most of these tools define both the message encoding, which typically uses a serialization library such as Protocol Buffers, and the network encoding, which is often something performant like HTTP/2. These tools can generate both client stubs and server stubs to help you implement the service.
So which protocol should you use? The next section goes through the key factors you should consider when deciding.
Key factors to consider
When trying to pick a service communication protocol, here are some of the key factors you should take into account:
- Programming language support
-
What programming languages are you using at your company? How many of them have good support for the message encoding you’re considering? JSON is supported in virtually every programming language; other serialization protocols are more hit or miss, though the more mature ones are typically supported in most popular programming languages.
- Client support
-
What clients does your API need to support? Will web browsers be talking directly to your services? Mobile apps? IoT? What protocols do those clients support, both for message and network encoding? HTTP + JSON are supported in virtually every client, and are native to web browsers; other serialization protocols are more hit or miss, especially with web browsers.
- Schema and code generation
-
Does the message encoding support defining a schema? Can you automatically generate client stubs in various programming languages for that schema? Can you automatically generate documentation? This is one area where serialization libraries and RPC libraries typically shine and HTTP + JSON are weaker; that said, tools like OpenAPI can help fill that gap for HTTP + JSON.
- Ease of debugging
-
How hard is it to test an API built with this tool or to debug problems? With HTTP + JSON, this is typically easy, as you can use any HTTP client (e.g.,
curl). Serialization and RPC libraries often require special tooling for testing. - Performance
-
How efficient are the message and network encoding in terms of bandwidth, memory, and CPU usage? This is an area where serialization and RPC libraries are usually going to come out well ahead of HTTP + JSON.
- Ecosystem
-
How big is the ecosystem around the message encoding? How is the documentation? How often are there updates and new releases? How many tools, plugins, and related projects are there? How hard is it to hire developers who know how to use this message encoding? How hard is it to find answers on StackOverflow? HTTP + JSON have the largest ecosystem, by far; Protocol Buffers and gRPC (which uses Protocol Buffers under the hood) are arguably a distant second.
As a general rule, I would default to HTTP + JSON for most APIs, and only consider alternatives in special cases: e.g., at large scale, where you have hundreds of services and tens of thousands of queries per second, the better performance and standardization you get with gRPC may pay off.
Now that you know how to define APIs for your services, let’s talk about how to manage your services at scale using service meshes.
Service Mesh
A service mesh is a networking layer that is designed to help manage communication between applications in a microservice architecture by providing a single, unified solution to the following problems:
- Security
-
In Part 6, you deployed microservices in Kubernetes that were able to talk to each other via HTTP requests. In fact, not only could these microservices talk to each other, but anyone could talk to them, as these services responded blindly to any HTTP request that came in. Putting these microservices in a private network provides some protection (the castle-and-moat model), but as your company scales, you will most likely want to harden the security around your services (the zero-trust model) by enforcing encryption, authentication, and authorization.
- Observability
-
As you saw in Part 6, microservice architectures introduce many new failure modes and moving parts that can make debugging harder than with a monolith. In a large services architecture, understanding how a single request is processed can be a challenge, as that one request may result in dozens of API calls to dozens of services. This is where observability tools such as distributed tracing, metrics, and logging become essential. You’ll learn more about these topics in Part 10.
- Resiliency
-
If you’re at the scale where you are running many services, you’re at a scale where bugs, performance issues, and other errors happen many times per day. If you had to deal with every issue manually, you’d never be able to sleep. In order to have a maintainable and resilient microservice architecture, there are a number of tools and techniques you can use to recover from or avoid errors automatically, including retries, timeouts, circuit breakers, and rate limiting.
- Traffic management
-
As you saw in Part 6, breaking a monolith into services means you are now managing a distributed system. With distributed systems, you often need a lot of fine-grained control over network traffic, including load balancing between services, canary deployments (as you saw in Part 5), and traffic mirroring (i.e., sending a duplicate of traffic to an extra endpoint for analysis or testing).
Almost all of these are problems of scale. If you only have two or three services, a small team, and not a lot of load, these problems are not likely to affect you, and a service mesh may be an unnecessary overhead. If you have hundreds of services owned by dozens of teams and high load, these are problems you’ll be dealing with every day. If you try to solve these problems one at a time, you’ll find it is a huge amount of work, and that the solution to one has an impact on the other: e.g., how you manage encryption affects your ability to do tracing and traffic mirroring. Moreover, the simple solutions you’re likely to try first may require you to make code changes to every single app, and as you learned in Part 6, rolling out global changes across many services can take a long time.
This is where a service mesh can be of use. It gives you an integrated, all-in-one solution to these problems, and just as importantly, it can solve most of these problems in a way that is transparent, and does not require you to change your app code.
|
Key takeaway #7
A service mesh can improve security, observability, resiliency, and traffic management in a microservices architecture, without having to update the application code of each service. |
When things are working, a service mesh can feel like a magical way to upgrade the security and debuggability of your microservice architecture. However, when things aren’t working, the service mesh itself can be difficult to debug, as it introduces many new moving parts (encryption, authentication, authorization, routing, firewalls, tracing). Moreover, understanding, installing, configuring, and managing a service mesh can be a lot of overhead. If you’re at the scale where you need solutions to the problems listed earlier, it’s worth it; if you’re a tiny startup, it’ll only slow you down.
Service mesh tools can be broken down into three buckets. The first bucket is the service mesh tools designed for use with Kubernetes, which includes Linkerd (the project that coined the term "service mesh"), Istio, and Cilium. The second bucket is managed service mesh tools from cloud providers, such as AWS App Mesh and Google Cloud Service Mesh. The third bucket is service mesh tools that can be used with any orchestration approach (e.g., Kubernetes, EC2, on-prem servers, etc.), such as Consul service mesh and Kuma (full list).
The best way to get a feel for what a service mesh does is to try one out, so let’s go through an example of using Istio with Kubernetes.
Example: Istio Service Mesh with Kubernetes Microservices
Istio is a popular service mesh for Kubernetes that was originally created by Google, IBM, and Lyft, and open sourced in 2017. Let’s see how Istio can help you manage the two microservices you deployed with Kubernetes in Part 6. One of those microservices was a backend app that exposed a simple JSON-over-HTTP REST API and the other microservice was a frontend app that made service calls to the backend, using the service discovery mechanism built into Kubernetes, and then rendered the data it got back using HTML. First, make a copy of those two sample apps into the folder you’re using for this blog post’s examples:
$ cd fundamentals-of-devops

$ cp -r ch6/sample-app-frontend ch7/

$ cp -r ch6/sample-app-backend ch7/
Second, you’ll need a Kubernetes cluster. The easiest one to use for learning and testing is the one that comes with Docker Desktop, so just as you did in Part 3, fire up that cluster, and make sure you’re authenticated to it:
$ kubectl config use-context docker-desktop
Third,
download and install the latest Istio release
(minimum version 1.22). The release will be in a folder called
istio-<VERSION>, where <VERSION> is the version
of Istio you installed, and it will include a samples folder which has
some useful sample code (which you’ll use shortly), and
istioctl, a CLI tool that has useful helper functions for working
with Istio (which you should add to your PATH). Use
istioctl to install Istio in your Kubernetes cluster as follows:
$ istioctl install --set profile=minimal -yThis uses a minimal profile to install Istio, which is good enough for learning and testing (see the install instructions for profiles you can use for production). The way Istio works is to inject its own sidecar into every Pod you deploy into Kubernetes. That sidecar is what provides all the security, observability, resiliency, and traffic management features, without you having to change your application code. To configure Istio to inject its sidecar into all Pods you deploy into the default namespace, run the following command:
$ kubectl label namespace default istio-injection=enabledIstio supports a number of integrations with observability tools. For this example, let’s use the sample add-ons that come with the Istio release, which include a dashboard for Istio called Kiali, a database for monitoring data called Prometheus, a UI for visualizing monitoring data called Grafana, and a distributed tracing tool called Jaeger:
$ cd istio-<VERSION>

$ kubectl apply -f samples/addons

$ kubectl rollout status deployment/kiali -n istio-system
At this point, you can verify everything is installed correctly by running the
verify-install command:
$ istioctl verify-installIf everything looks good, deploy the frontend and backend apps as you did before:
$ cd ../sample-app-backend

$ kubectl apply -f sample-app-deployment.yml

$ kubectl apply -f sample-app-service.yml

$ cd ../sample-app-frontend

$ kubectl apply -f sample-app-deployment.yml

$ kubectl apply -f sample-app-service.yml
After a few seconds, you should be able to make a request to the frontend as follows:
$ curl localhost

<p>Hello from <b>backend microservice</b>!</p>
At this point, everything should be working exactly as before. So is Istio doing anything? One way to find out is to open up the Kiali dashboard you installed earlier:
$ istioctl dashboard kialiThis command will open the dashboard in your web browser. Click Traffic Graph in the nav on the left, and you should see something similar to Figure 69:
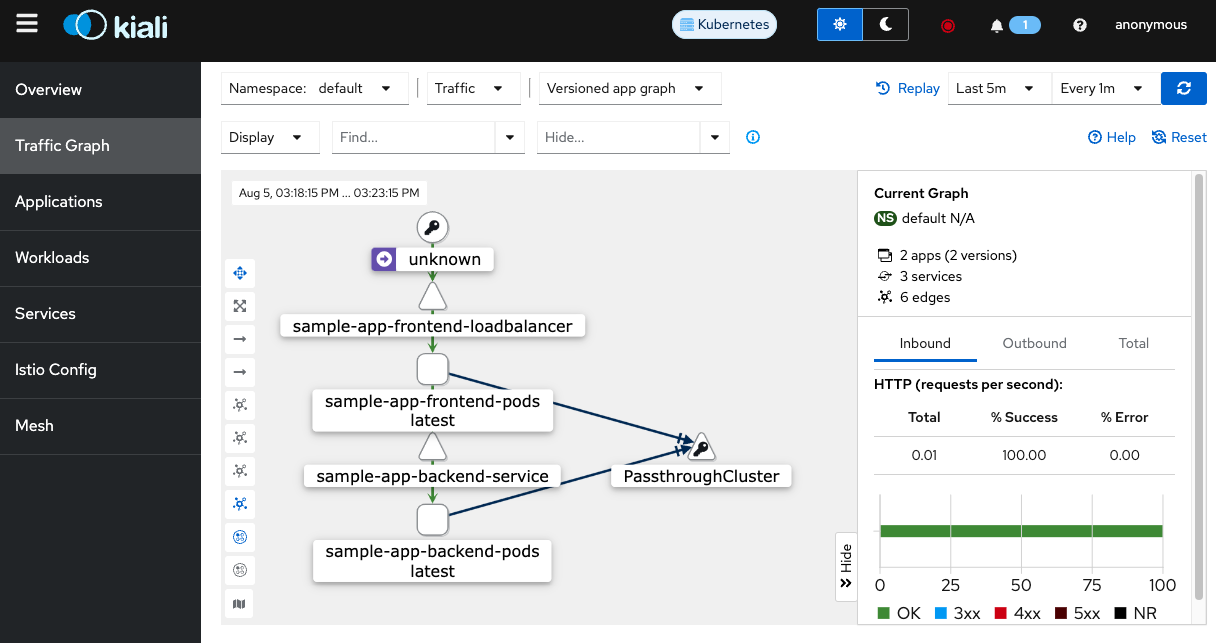
If the Traffic Graph doesn’t show you anything, run
curl localhost several more times, and then click the refresh button
in the top right of the dashboard. You should see a visualization of the path your
requests take through your microservices, including through the Services and Pods.
Right away, you see one of the key benefits of a service mesh: observability. You
get not only this service mesh visualization, but also aggregated logs (click on
Workloads in the left nav, select sample-app-backend, and click the Logs tab),
metrics (run istioctl dashboard grafana), and distributed traces (run
istioctl dashboard jaeger). When you’re done experimenting with
Kiali, hit CTRL+C to exit.
Another key benefit of service meshes is security, including support for automatically encrypting, authenticating, and authorizing all requests within the service mesh. By default, to make it possible to install Istio without breaking everything, Istio initially allows unencrypted, unauthenticated, and unauthorized requests to go through. However, you can change this by configuring policies in Istio. Create a new folder called istio, and within it, a file called istio-auth.yml, with the content shown in Example 132:
apiVersion: security.istio.io/v1beta1

kind: PeerAuthentication               (1)

metadata:

  name: require-mtls

  namespace: default

spec:

  mtls:

    mode: STRICT


---                                    (2)

apiVersion: security.istio.io/v1

kind: AuthorizationPolicy              (3)

metadata:

  name: allow-nothing

  namespace: default

spec:

  {}
This code does the following:
| 1 | Create an authentication policy that requires all service calls to use mTLS (mutual TLS), which is a way to enforce that every connection is encrypted and authenticated (you’ll learn more about TLS in Part 8). One of the benefits of Istio is that it handles mTLS for you, completely transparently. |
| 2 |
Note the use of ---: this is a divider that allows you to put
multiple Kubernetes configurations in a single YAML file.
|
| 3 | Create an authorization policy which blocks all service calls by default, so your services don’t respond to anyone who happens to have network access. You can then add additional authorization policies to allow just the service communication that you know is valid. |
Deploy these policies as follows:
$ cd ../istio

$ kubectl apply -f istio-auth.yml
Now, look what happens if you try to access the frontend app again:
$ curl localhost

curl: (52) Empty reply from server
Since your request to the frontend wasn’t using mTLS, Istio rejected the connection immediately. Enforcing mTLS makes sense for backends, as they should only be accessible to other services, but your frontend should be accessible to users outside your company, so you can disable the mTLS requirement for the frontend as shown in Example 133:
apiVersion: security.istio.io/v1beta1

kind: PeerAuthentication

metadata:

  name: allow-without-mtls

  namespace: default

spec:

  selector:

    matchLabels:

      app: sample-app-frontend-pods (1)

  mtls:

    mode: DISABLE                   (2)
This is an authentication policy that works as follows:
| 1 | Target the frontend Pods. |
| 2 | Disable the mTLS requirement for the frontend Pods. |
You can put the YAML in
Example 133 into a new YAML
file, but dealing with too many YAML files for the frontend is tedious and
error-prone. Let’s instead use the --- divider to combine the
frontend’s
sample-app-deployment.yml, sample-app-service.yml, and the YAML
you just saw in Example 133
into a single file called kubernetes-config.yml, with the structure shown
in
Example 134:
apiVersion: apps/v1

kind: Deployment

# ... (other params omitted) ...


---

apiVersion: v1

kind: Service

# ... (other params omitted) ...


---

apiVersion: security.istio.io/v1beta1

kind: PeerAuthentication

# ... (other params omitted) ...
With all of your YAML in a single kubernetes-config.yml, you can delete
the sample-app-deployment.yml and
sample-app-service.yml files, and deploy changes to the frontend app with
a single call to kubectl apply:
$ cd ../sample-app-frontend

$ kubectl apply -f kubernetes-config.yml
Try accessing the frontend again, adding the --write-out flag so that
curl prints the HTTP response code after the response body:
$ curl --write-out '\n%{http_code}\n' localhost

RBAC: access denied

403
You got an error again, but this time, it’s a different error. That’s
because there are two policies at play: an authentication policy and an
authorization policy. You added an authentication policy that allows the frontend
to be accessed without mTLS, so Istio is no longer blocking your request entirely,
but you still got a 403 response code (Forbidden) because the
allow-nothing authorization policy is still blocking all requests. To
fix this, you need to add authorization policies to the backend and the frontend.
This requires that Istio has some way to identify the frontend and backend. Istio uses Kubernetes service accounts as identities, automatically providing a TLS certificate to each application based on its service account, and using mTLS to provide mutual authentication (i.e., the backend will verify the request is coming from the frontend, and the frontend will verify it is really talking to the backend). Istio will handle all the TLS details for you, so all you need to do is associate the frontend and backend with their own service accounts and add an authorization policy to each one.
Start with the frontend, updating its kubernetes-config.yml as shown in Example 135:
apiVersion: apps/v1

kind: Deployment

spec:

  replicas: 2

  template:

    metadata:

      labels:

        app: sample-app-frontend-pods

    spec:

      serviceAccountName: sample-app-frontend-service-account (1)

      containers:

        - name: sample-app-frontend

# ... (other params omitted) ...


---

apiVersion: v1

kind: ServiceAccount

metadata:

  name: sample-app-frontend-service-account                   (2)


---

apiVersion: security.istio.io/v1

kind: AuthorizationPolicy                                     (3)

metadata:

  name: sample-app-frontend-allow-http

spec:

  selector:

    matchLabels:

      app: sample-app-frontend-pods                           (4)

  action: ALLOW                                               (5)

  rules:                                                      (6)

  - to:

    - operation:

        methods: ["GET"]
Here are the updates to make to the frontend:
| 1 | Configure the frontend’s Deployment to use the service account created in (2). |
| 2 | Create a service account for the frontend. |
| 3 | Add an authorization policy for the frontend. |
| 4 | The authorization policy targets the frontend’s Pods. |
| 5 | The authorization policy will allow requests that match the rules in (6). |
| 6 |
Define rules for the authorization policy, where each rule can optionally
contain from (sources) and to
(destinations) to match. The preceding code allows the frontend to receive
HTTP GET requests from all sources.
|
Run apply to deploy these changes to the frontend:
$ kubectl apply -f kubernetes-config.yml
Next, head over to the backend, and combine its Deployment and Service definitions
into a single
kubernetes-config.yml file, separated by ---, just like you
did for the frontend (and then delete
sample-app-deployment.yml and sample-app-service.yml). Once
that’s done, update the backend’s
kubernetes-config.yml as shown in
Example 136:
apiVersion: apps/v1

kind: Deployment

spec:

  replicas: 3

  template:

    metadata:

      labels:

        app: sample-app-backend-pods

    spec:

      serviceAccountName: sample-app-backend-service-account (1)

      containers:

        - name: sample-app-backend

# ... (other params omitted) ...


---

apiVersion: v1

kind: ServiceAccount

metadata:

  name: sample-app-backend-service-account                   (2)


---

apiVersion: security.istio.io/v1                             (3)

kind: AuthorizationPolicy

metadata:

  name: sample-app-backend-allow-frontend

spec:

  selector:

    matchLabels:

      app: sample-app-backend-pods                           (4)

  action: ALLOW

  rules:                                                     (5)

  - from:

    - source:

        principals:

          - "cluster.local/ns/default/sa/sample-app-frontend-service-account"

    to:

    - operation:

        methods: ["GET"]
Here are the updates to make to the backend:
| 1 | Configure the backend’s Deployment to use the service account created in (2). |
| 2 | Create a service account for the backend. |
| 3 | Add an authorization policy for the backend. |
| 4 | Apply the authorization policy to the backend’s Pods. |
| 5 | Define rules that allow HTTP GET requests to the backend from the service account of the frontend. |
Run apply to deploy these changes to the backend:
$ cd ../sample-app-backend

$ kubectl apply -f kubernetes-config.yml
And now test the frontend one more time:
$ curl --write-out '\n%{http_code}\n' localhost

<p>Hello from <b>backend microservice</b>!</p>

200
Congrats, you got a 200 (OK) response code and the expected HTML response body, which means you now have microservices running in Kubernetes, using service discovery, and communicating securely via a service mesh! With the authentication and authorization policies you have in place, you have significantly improved your security posture: all communication between services (such as the request the frontend successfully made to the backend) is now encrypted, authenticated, and authorized—all without you having to modify the Node.js source code of either app. Moreover, you have access to all the other service mesh benefits, too: observability, resiliency, and traffic management.
|
Get your hands dirty
Here are a few exercises you can try at home to go deeper:
|
When you’re done testing, you can run delete on the
kubernetes-config.yml files of the frontend and backend to clean up
the apps. If you wish to uninstall Istio, first, remove the global authorization
and authentication policies:
$ cd ../istio

$ kubectl delete -f istio-auth.yml
Next uninstall the addons:
$ cd ../istio-<VERSION>

$ kubectl delete -f samples/addons
And finally, uninstall Istio itself, including deleting its namespace, and removing the default labeling behavior:
$ istioctl uninstall -y --purge

$ kubectl delete namespace istio-system

$ kubectl label namespace default istio-injection-
One of the benefits of software-defined networking is that it’s fast and easy to try out different networking approaches. Instead of having to spend hours or days setting up physical routers, switches, and cables, you can try out a tool like Istio in minutes, and if it doesn’t work for you, it only takes a few more minutes to uninstall Istio, and try something else.
Conclusion
You’ve now seen the central role networking plays in connectivity and security, as per the 7 key takeaways from this blog post:
-
You get public IP addresses from network operators such as cloud providers and ISPs.
-
DNS allows you to access web services via memorable, human-friendly, consistent names.
-
Use a defense-in-depth strategy to ensure you’re never one mistake away from a disaster.
-
Deploy all your servers into private networks by default, exposing only a handful of locked-down servers to the public Internet.
-
In the castle-and-moat model, you create a strong network perimeter to protect all the resources in your private network; in the zero-trust model, you create a strong perimeter around each individual resource.
-
As soon as you have more than one service, you will need to figure out a service discovery solution.
-
A service mesh can improve security, observability, resiliency, and traffic management in a microservices architecture, without having to update the application code of each service.
Putting these all together, you should now be able to picture the full network architecture you’re aiming for, as shown in Figure 70. Inside your data center, you have a private network, such as a VPC. Within this network, almost all of your servers are in private subnets. The only exceptions are highly-locked down servers designed to accept traffic directly from customers, such as load balancers, and highly-locked down bastion hosts for your employees, such as an access proxy.
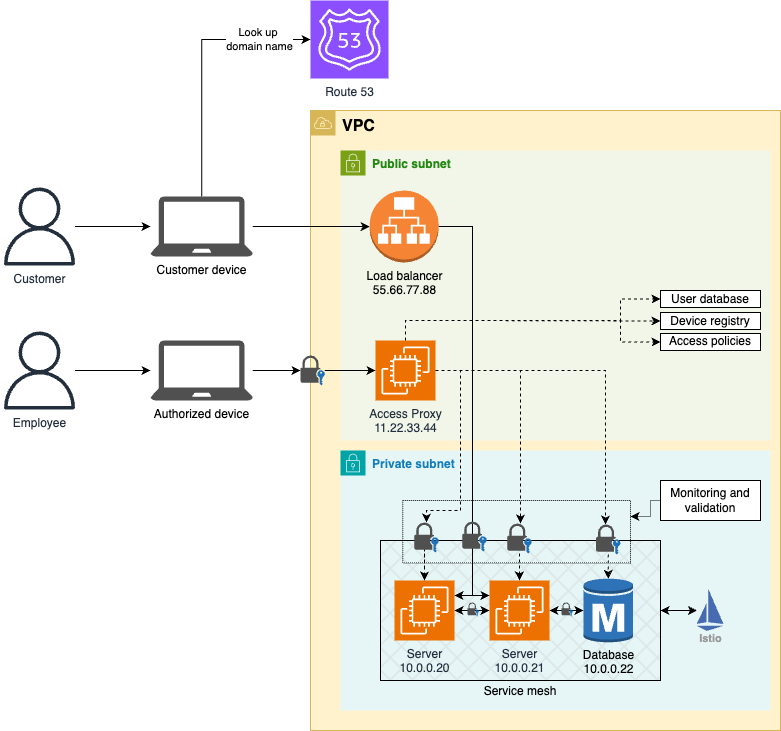
When a customer visits your website, their computer looks up your domain name using DNS, gets the public IP addresses of your load balancers, makes a request to one of those IPs, and the load balancer routes that request to an app server in the private subnets. That app server processes the request, communicates with other services—using service discovery to find those services, and a service mesh to enforce authentication, authorization, and encryption—and returns a response. When an employee needs to access something on your internal network, such as a wiki, they authenticate to the access proxy, which checks the user, their device, and access policies, and if the employee is authorized, the proxy gives them access to just that wiki.
As you went through this blog post, you repeatedly came across several key security concepts such as authentication and secrets. These concepts affect not only networking, but all aspects of software delivery, so let’s move on to Part 8, where we do a deeper dive on security.
Update, June 25, 2024: This blog post series is now also available as a book called Fundamentals of DevOps and Software Delivery: A hands-on guide to deploying and managing software in production, published by O’Reilly Media!

,_Wales_05.jpg)